
It almost goes without saying that the number one number that everyone watches is market share. Yet, counter-intuitively, it’s the number that explains the least. It tells you your position in the market relative to the others, but not why you’re there, and it provides no insight on what to do next, to either maintain or improve the ranking.
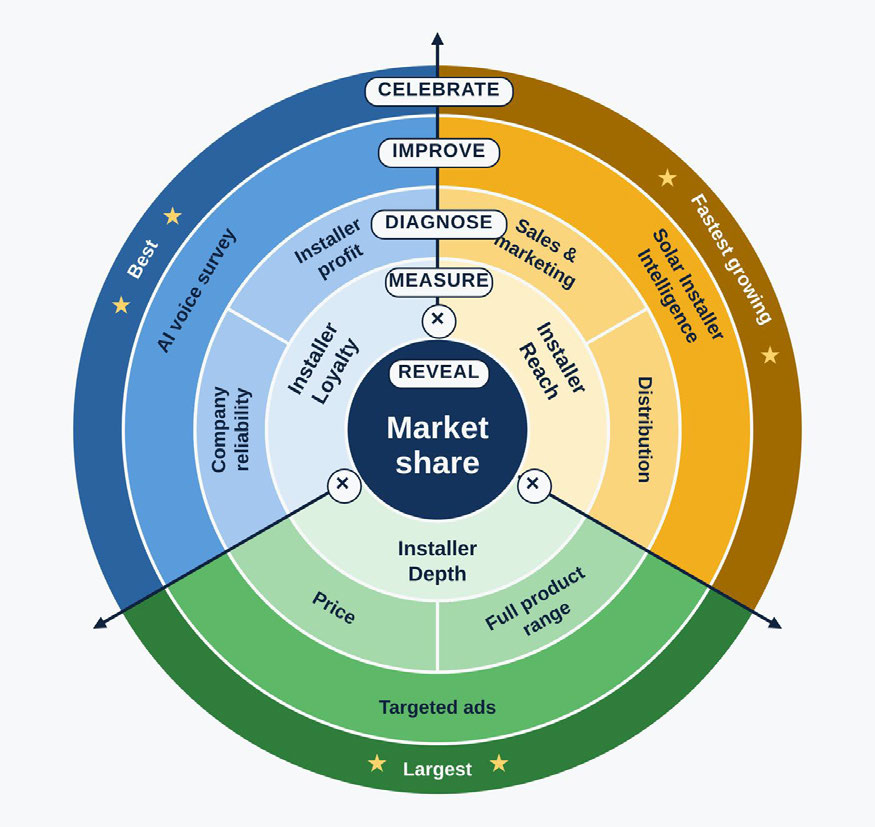
The SunWiz Method unpacks what causes market share. Market share is what you get when a lot of installers use you, for a lot of their installations, a lot of the time. Those three conditions are three KPIs, and each one answers to a different set of levers:
- Installer Reach: the share of active installers who installed your brand in a period. It comes from sales, marketing and distribution. Installers cannot choose a brand they have not met or cannot buy.
- Installer Depth: when an installer uses your brand, the share of their battery portfolio you hold. It comes from product-market fit. Installers use more of a brand when its range and price solve more of the jobs in front of them.
- Installer Loyalty: whether those installers keep choosing you, month after month. It comes from the right price and good customer service, sustained. Installers come back to brands that are reliable and that close.
Underneath all three sits one requirement: the brand has to generate a healthy profit for the installer on each opportunity that comes their way. Every KPI in this series is a way of measuring whether that is happening.
That is why the method is useful to two kinds of brand. A brand defending a position needs to know which of the three is slipping before the share number moves, because each one is fixed differently. A brand trying to grow needs to know which of the three is holding it back, so it spends its effort on the right lever rather than on all of them at once. We work through five steps: Reveal the share, Measure the KPIs, Diagnose the levers behind each one, Improve with targeted tools, and Celebrate the result.
Fox ESS as an example of the SunWiz Method
In July 2025, Fox ESS held less than 1% of Australia’s home battery market. By March 2026 it held 28%[1]. Across the first half of 2026 it was the number one battery brand in the country by capacity installed.
That is one of the fastest climbs SunWiz has measured. It is worth understanding how it happened, because the answer is not “the rebate”. Every brand had the rebate. Nor is it a flash in the pan: Fox ESS is an established brand that SunWiz data ranks number one by volume in both the UK and Germany, and it has stayed in Australia’s top three every month since the rebate changed.
This series uses the SunWiz Method to take Fox ESS’s rise apart, one KPI at a time, as an example of what mastering all three looks like. This post covers Installer Reach. Part 2 covers Installer Depth. Part 3 covers Installer Loyalty, and closes on what the three together reveal.
A note on the figures. Fox ESS advises that its presence is larger than SunWiz’s sample describes here, because some of its channels sit outside our visibility. Treat the shares below as a floor. The trends are what matter, and they are robust.
Reveal: the climb, and what went into it
The Cheaper Home Batteries Program started on 1 July 2025. Within SunWiz’s dataset, Fox ESS’s share that month was 1%. Then it rose every single month: 2% in August, 4% in September, 8% in October, 14% by December, 20% in January 2026 and 28% in March. Nine consecutive months of growth, no reversals.
April alone, the month before the rebate was tiered by battery size, delivered more than a quarter of Fox ESS’s volume for the year. The net result: such a strong April 2026 that SunWiz recognised Fox ESS as the largest battery brand in Australia for H1-2026.
The market has reshaped since. The May 2026 rebate change caused a fall in volumes for every brand. Any concern that Fox ESS had the wrong product for the new rules has been put to rest, and part 2 of this series shows why.
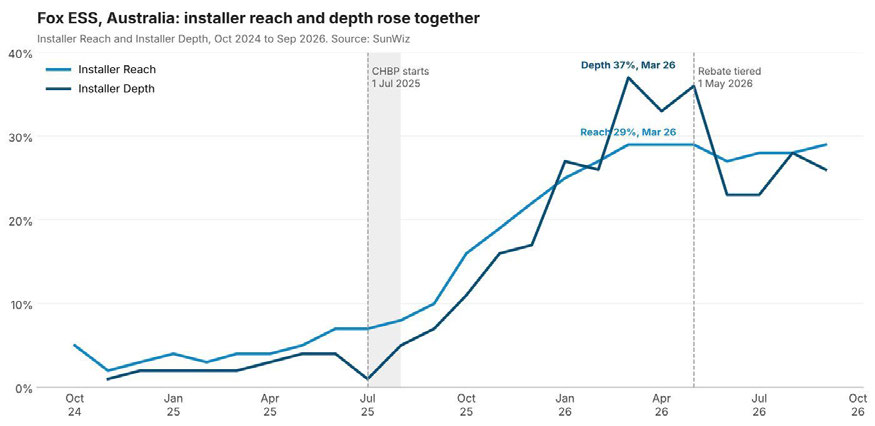
Fox ESS’s success came because of a combination of Installer Reach and Depth. The chart below shows Reach and Depth climbed together from mid-2025. Fox ESS’s greatest driver of market leadership was Installer Depth, as you’ll see in the coming sections.
Measure: reach that grew every month
Installer Reach tells you how wide a brand’s installer base is. Through the first half of 2025, Fox ESS was installed by 3 to 5% of active battery installers. Then:
| Month | Fox ESS installer reach |
|---|---|
| June 2025 | 7% |
| September 2025 | 10% |
| October 2025 | 16% |
| December 2025 | 22% |
| March 2026 | 29% |
By March 2026, nearly one in three active battery installers installed a Fox ESS battery that month, up from one in twenty a year earlier. And the reach stuck. It was 29% in April, and sustained that level in the months after the rebate change. Installers did not leave when the rules changed.
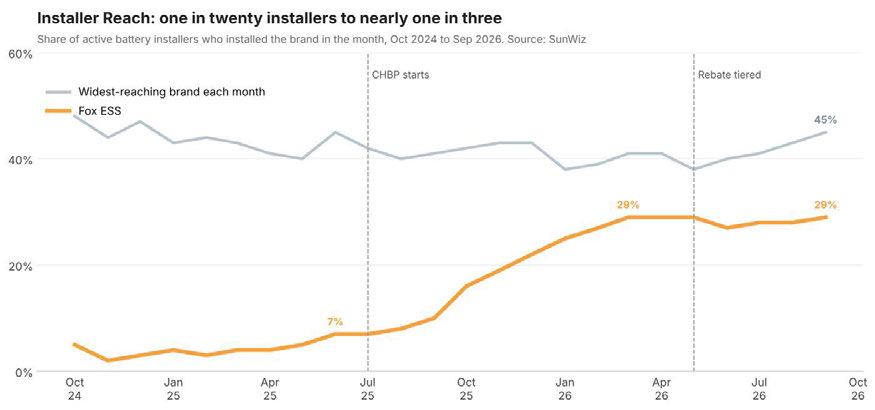
Two things make this noteworthy. First, it was steady. Reach rose in every month from June 2025 to March 2026. Second, it happened while other brands were losing installers. Over the same twelve months, two of the brands Fox ESS overtook saw their reach roughly halve.
But Fox ESS didn’t get to the top by having the most installers. The two widest-reaching brands were installed by 39 to 45% of installers at their peak, considerably more than Fox ESS’s installer base. This offers a clue to what part 2 is about (and also means there is still headroom for Fox ESS to grow).
Diagnose: where the reach was built
Installer Reach is never evenly spread. Fox ESS built its base where the volume was.
New South Wales, the largest battery state. Fox ESS became the number one battery brand in NSW by capacity during the first half of 2026, and number one in Victoria and the ACT as well. Across the full year it ranks number two in all three. More than half of its recent monthly capacity comes from NSW.
Most of Fox ESS’s volume comes from the largest installers, the mammoth and large categories. That is where fast reach growth usually comes from, because a handful of big accounts switching brands moves the number quickly. It also means the base is concentrated, which part 3 returns to.
There are still opportunities for Fox ESS to grow geographically, and through the long tail of smaller installers.
Improve: the SunWiz tools to improve installer reach
Reach is driven by three levers: sales, marketing and distribution. Each needs a different action, and the first job is knowing which one to pull. SunWiz provides tools for each:
- Solar Installer Intelligence (SII) maps the installers in a market and connects manufacturers with them directly. For a brand in Fox ESS’s position it shows which SA and Queensland installers are not yet using the brand, and who they buy from instead.
- Distributor evaluation tests whether weak reach in a state is a distribution problem. A brand can be well marketed and still hard to buy in the wrong region.
- Targeted advertising strategy identifies which individual installers to reach, and with what message.
- AI-driven voice installer survey asks installers, in their own words, why they chose a brand. Because it is voice-led, an installer can answer from the ute between jobs, and every answer comes with context.
See your own reach
Every SunWiz Brand Assessor starts here: your installer reach by month, by state and by installer size, benchmarked against the leaders. It shows whether your share is moving because of reach or because of something else, before you spend money fixing the wrong thing.
Book a Brand Assessor walkthrough to see your brand’s reach.
[1] Note SunWiz’s market share figures differ from those supplied by Fox ESS, which infer Fox ESS’s market share is greater than stated here.
Next in the series: Installer Depth, and why Fox ESS led share of installer wallet with fewer installers than its rivals.