In previous articles (Installer Reach and Installer Depth), we explained in depth how Fox ESS grew to become the largest battery supplier to Australia in H1-2026. Nearly one in three installers used it, and those installers gave it more than a third of their battery work. Both numbers came from having the right product, at the right price, at the moment Australia became a large-battery market.
In those articles, we explored two KPIs that underlined the market share result. The third KPI asks a harder question. A surge can be a wave of new installers trying a brand once. Did Fox ESS’s installers stay?
What drives loyalty
Installer Loyalty is reach and depth sustained over time. Installers stay with a brand when two things are true: the company is reliable, and the product makes them money. The clearest signal of both is pull-through, the share of customer proposals featuring a brand that become sales. A brand that helps installers close jobs earns the next job.
Fox ESS installers buy every month
SunWiz tracks every installer’s relationship with a brand: those who buy every month, those who return, those who have just started and those who have stopped. For Fox ESS through the surge:
| Month | From installers buying every month | From installers buying for the first time | From installers who then stopped |
|---|---|---|---|
| October 2025 | 78% | 1% | 5% |
| January 2026 | 64% | 4% | 2% |
| March 2026 | 56% | 8% | 1% |
| April 2026 | 54% | 11% | 1% |
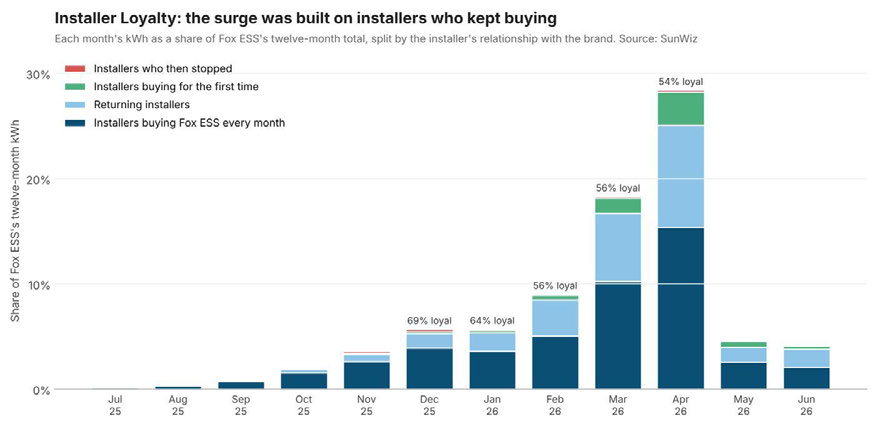
Two things happened at once. Through the entire climb, more than half of each month’s volume came from installers who bought Fox ESS every month. At the same time, a growing wave of new installers arrived: 8% of March’s kWh and 11% of April’s came from installers buying Fox ESS for the first time. Installers who stopped were about 1% of volume.
That is the loyalty engine and the reach engine running together. Existing installers kept buying and bought more; new ones kept arriving; almost nobody left. April 2026 alone delivered 28% of Fox ESS’s kWh for the year, and it was more than half built on installers who had been buying every month.
Over the full twelve months, Fox ESS’s installer base looks like the market’s, with a slightly higher share of new installers and a slightly lower share of installers who stopped.
Diagnose: proposals that closed
SunWiz measures pull-through from customer proposal data, comparing how often proposals featuring each brand convert into sales. Over the past 24 months, Fox ESS’s answer depends on system size:
| System size | Fox ESS proposals that convert | All other brands |
|---|---|---|
| Under 30 kWh | 14% | 19% |
| 30 to 100 kWh | 26% | 21% |
| 100 to 1,000 kWh | 21% | 6% |
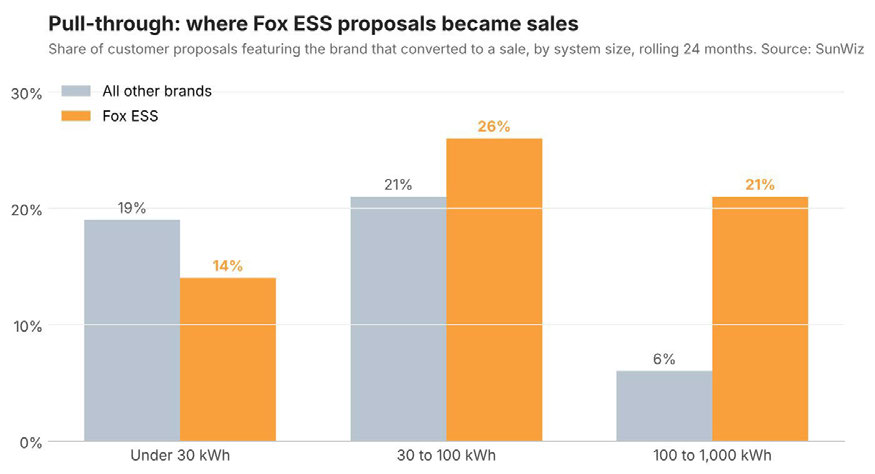
In the 30 to 100 kWh bracket, which is where the market was during the surge, Fox ESS converted 26% of proposals into sales. Above 100 kWh the gap is wider still.
This closes the loop with part 2. Fox ESS was the large-battery brand, the market moved to large batteries, and when an installer put a large Fox ESS battery in front of a customer, it closed more often than the alternatives. Installers go back to what closes.
The weak spot is small systems. Under 30 kWh, Fox ESS proposals converted less often than average. That was a minor segment during the surge, and it is the obvious place to look next.
Improve: the levers behind loyalty
Loyalty is built by making installers more successful. SunWiz provides tools that show where and how:
- Proposal win-likelihood assessment shows how likely a proposal featuring your brand is to become a sale, by system size and segment.
- Competitor-specific analysis shows how that win rate changes depending on which brand you are up against.
- Installer behaviour tracking separates installers who stopped, shrank, grew or started, so you know whether to fix retention, engagement or acquisition.
- AI-driven voice installer survey asks installers what would help them close more jobs: sales resources, pricing, warranty support or service.
Two of these are already in this post. The pull-through chart above is the proposal win-likelihood assessment in practice: the same analysis, run for any brand, by size bracket and against each competitor. The installer loyalty chart under Measure is installer behaviour tracking, which is how SunWiz separated “installers who shrank their volumes” from “installers who left” when Fox ESS’s volume fell after May.
Celebrate
The last step of the SunWiz Method is to celebrate what the data shows. The SunWiz Awards recognise the largest, fastest-growing and best-converting brands, measured on the same installer-level data as everything in this series.
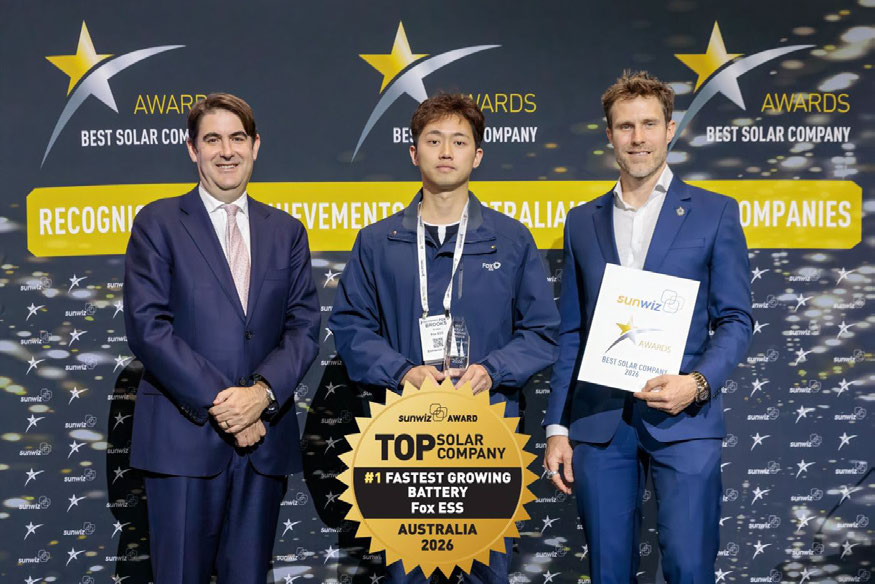
Fox ESS has earned two. At the 2026 Best Solar Company Awards, SunWiz recognised Fox ESS as the #1 Fastest Growing Battery brand in Australia, based on 2025 data, and it has since been recognised as the largest battery manufacturer for the first half of 2026. Both follow directly from the three KPIs: the reach and depth that built in 2025 produced the growth award, and the loyalty that held through the first half of 2026 produced the volume award.
Fox ESS through the SunWiz Method lens
| KPI | Fox ESS at the March 2026 peak | What drove it |
|---|---|---|
| Reach | 29% of active installers, up from 7% in June 2025 | Number one in NSW, Victoria and the ACT during H1 2026; steady monthly gains with no reversals |
| Depth | 37% of installers’ battery portfolio, the highest of any brand | 83 to 93% of kWh in 30 to 50 kWh systems as the market moved there; roughly half the price index of other brands in that bracket |
| Loyalty | Over half of monthly volume from every-month installers; about 1% churn | 26% proposal-to-sale conversion at 30 to 100 kWh, highest of the top three brands |
The SunWiz Method shows the three things that had to be true for that to happen, and it shows them for every brand in the market.
What the three KPIs reveal together
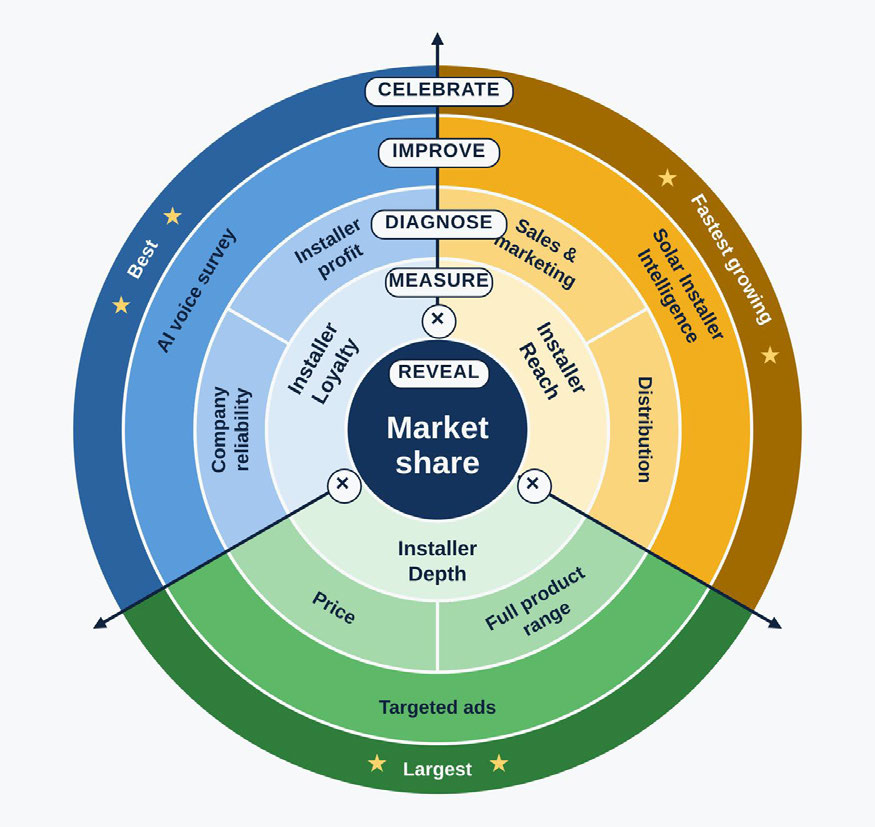
Part 1 opened with the statement the SunWiz Method is built on: market share is what you get when a lot of installers use you, for a lot of their installations, a lot of the time. Reach is the first of those, Depth the second, Loyalty the third. Underneath all of them, the brand has to make installers a healthy profit on each opportunity.
Seen together, the three KPIs tell a brand where to put its effort. If reach is low, the problem is sales, marketing or distribution. If reach is fine and depth is low, the problem is product-market fit, range or price. If both are fine and loyalty is low, the problem is service, reliability or how often proposals close. Fixing the wrong one is expensive, and the share number alone will not tell you which it is.
Fox ESS is the worked example of all three being true at once. It reached nearly a third of installers through NSW, Victoria and the ACT; it built a product that fitted the Australian market as the market sized up, and priced it so an installer made money on a 40 kWh job; and its proposals closed often enough that the installers who tried it kept using it. Share followed. The method shows that for every brand in the market, every month.
See your own reach, depth and loyalty
The SunWiz Brand Assessor measures all three KPIs for your brand, every month, benchmarked against the market. It diagnoses which lever is moving your share, and connects you to the tools that improve it.
Book a Brand Assessor walkthrough to see your brand through the SunWiz lens.