
The KPIs that quietly drive battery market share in Australia
The Australian residential battery market is heating up — and beneath the surface, a new set of performance metrics is emerging as decisive for brand success. While some manufacturers chase short-term growth by dropping prices, the real battle for sustainable market share is being fought on deeper metrics: share of installer adoption, share of installer portfolio, and customer loyalty.
SunWiz’s Luminate platform provides unique monthly visibility into these KPIs — offering brand-level insights into what’s driving growth, and which levers actually deliver long-term results.
The two multipliers behind market share
Market share doesn’t appear by magic — it’s the result of two measurable factors:
1. Installer Adoption Rate: What percentage of active installers are using your brand?
2. Share of Installer Portfolio: What portion of each installer’s total deployments are your products?
These two levers work together. Winning over more installers increases your exposure, but unless your product range aligns with their needs, it won’t translate into meaningful volume. Similarly, even loyal installers can’t grow your share if they only use your product occasionally.
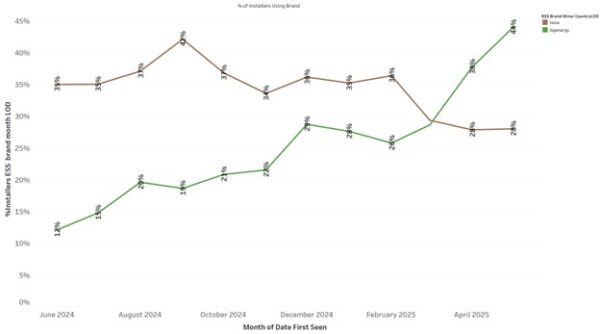
This chart illustrates how brands like Sigenergy have rapidly increased both their installer base and volume share over the past 12 months — leaping from 12% of installers in mid-2024 to 44% by May 2025.
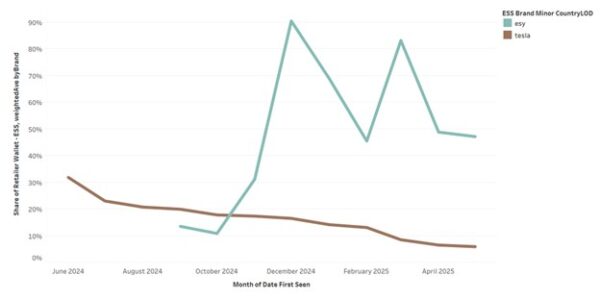
ESY is a more recent market entrant to Australia and is very competitively priced. Though not yet used by many installers, ESY has considerably increased its share-of-portfolio of installers that do use it. However, ESY’s share-of-installer-portfolio has fluctuated considerably, which may reflect a price-driven nature of its adoption. Meanwhile while Tesla was still being used by a significant number of installers, it occupied a declining percentage of each installer’s portfolio.
Why product-market fit still reigns supreme
One of the most important — yet often overlooked — determinants of share-of-wallet is product-market fit.
Brands offering a flexible range of battery sizes, particularly stackable systems, are best positioned to serve both retrofit and new PV plus ESS customers. This adaptability has become more critical since the introduction of the federal battery rebate, which encourages upsizing (e.g., moving from a 13 kWh to a 20 kWh-plus system without doubling the outlay).
In contrast, monolithic batteries face a challenge: their fixed sizing can make them a poor match for subsidy-driven consumers who are upsizing for maximum value.
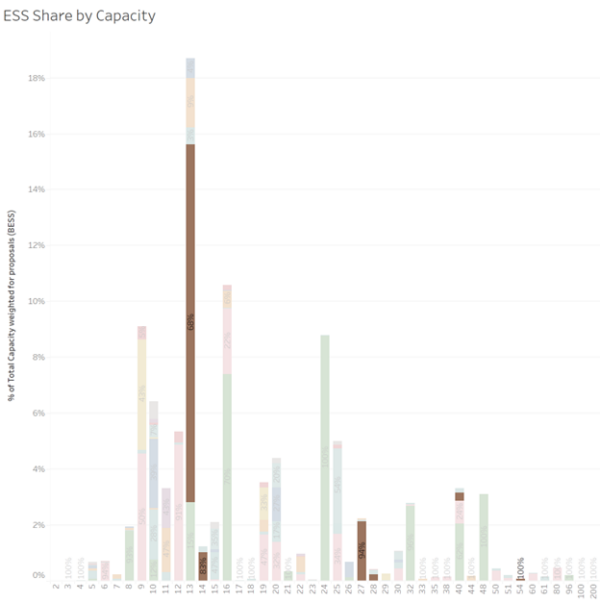
As shown in the capacity distribution chart below, Tesla dominates the 13kWh and 27kWh categories, but lacks presence in the many intermediate sizes where other brands thrive.