

Australia’s best-selling battery size lost most of its market within a month of the rebate changing. The quarterly average recorded a fall of a tenth. In the medium to long term, that’s actually a good sign.
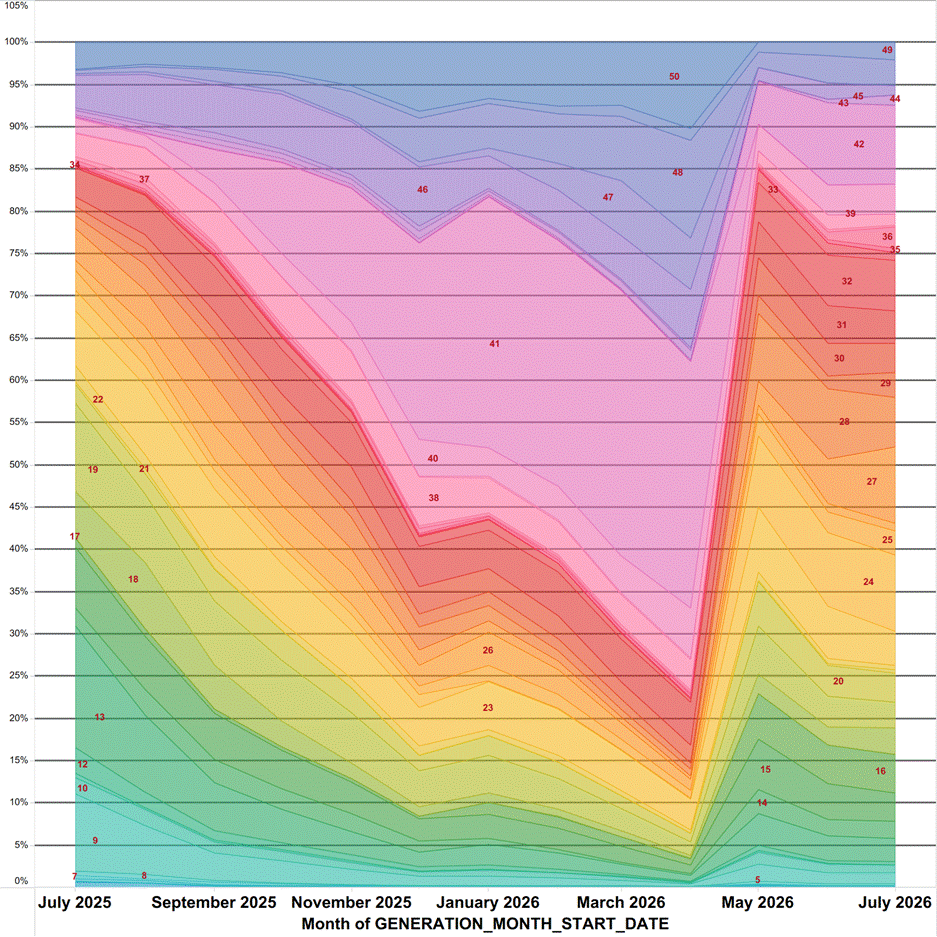
In April, batteries of around 41 kWh accounted for roughly a third of Australian installations. By July, no single size held more than about five per cent of the market. Volume had scattered across the mid-20s and low-30s, and small systems that had almost disappeared were selling again.
The federal rebate launched in July 2025 and paid per kilowatt-hour of usable capacity with no taper by size, so households had every reason to buy the largest system that would fit on the wall. From 1 May 2026 the support began tapering as capacity rises, and the value band moved down. Buyers followed the money inside a single month.
For anyone selling batteries into Australia, that was worth knowing in May. A manufacturer watching average system size would have seen a decline of about a tenth across the quarter and had no particular reason to act. The average is a poor instrument for that decision, because manufacturers build products at fixed capacities, and the average rarely sits where the buyers are.
This is happening against an encouraging backdrop. Batteries have been getting bigger in every market we track, from about 11 kWh in Ireland to 27 kWh in Australia, and larger storage means households cover more of the evening on their own supply.
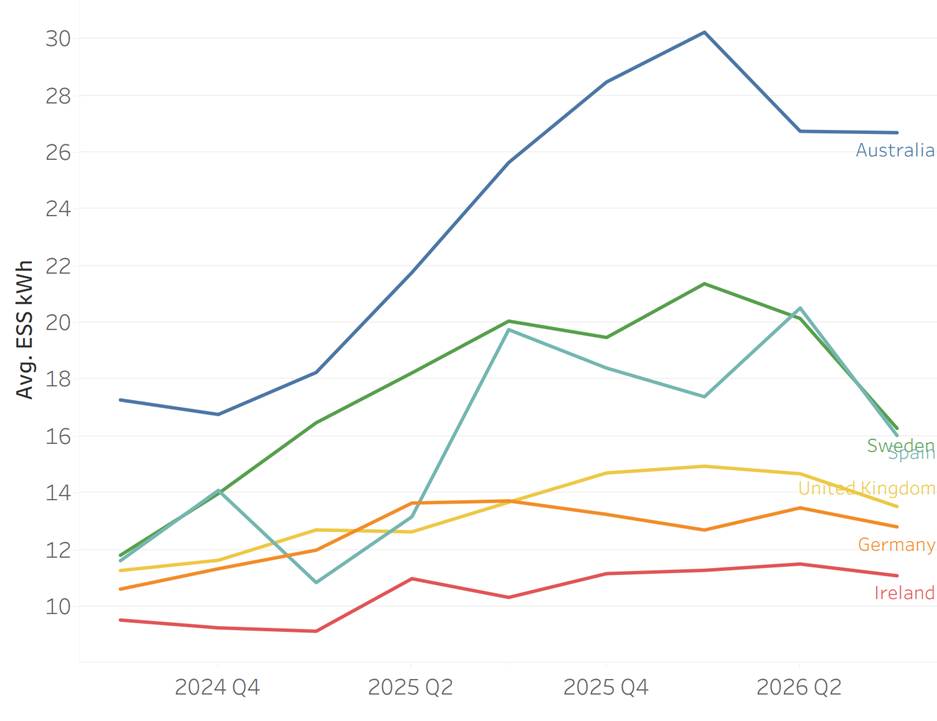
Sweden and Spain, both at 16 kWh
Sweden and Spain finish the period at almost identical averages of about 16 kWh. The two markets have little else in common.
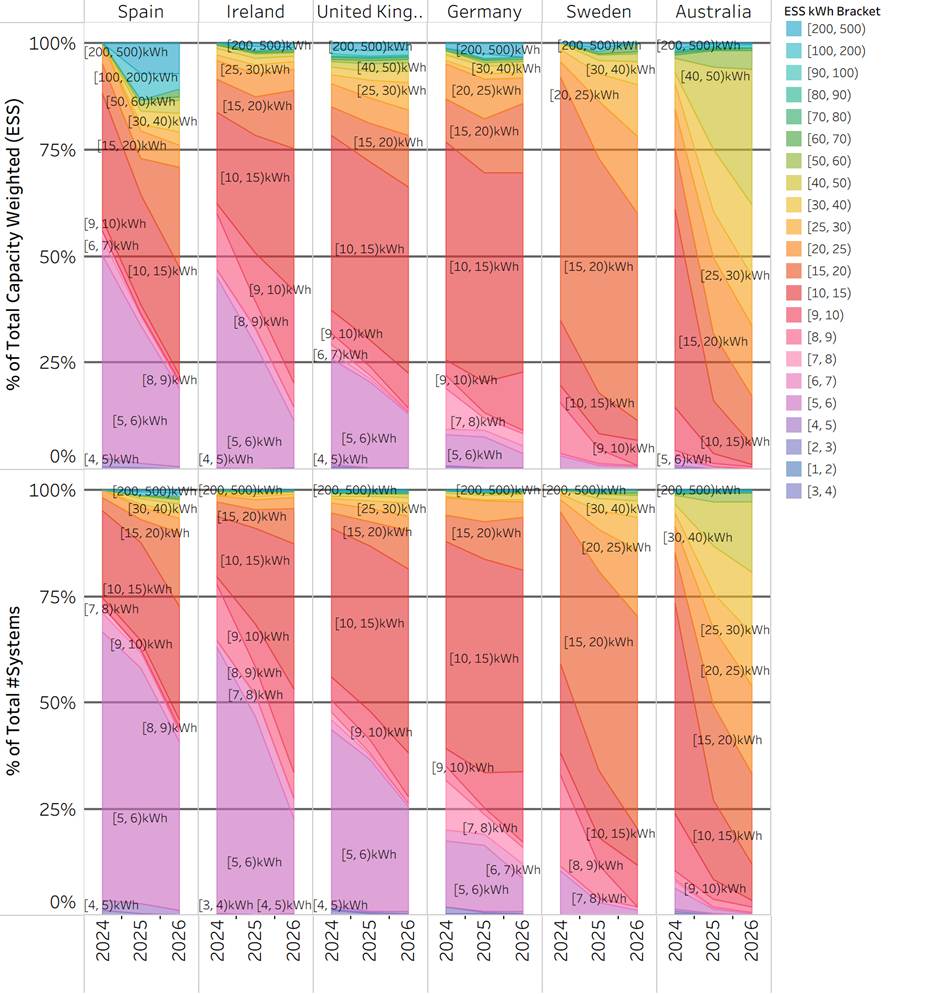
Swedish demand is concentrated. The largest size band takes a substantial plurality of installations, most of the remainder sits immediately above it, and there is very little activity below 10 kWh. Two products either side of the 15 to 20 kWh band would cover most of the country.
Spanish demand is split three ways. Systems of 5 to 6 kWh make up close to half of installations by unit count. A second block sits between 10 and 20 kWh. A handful of commercial-scale systems, which the Spanish sample includes, pull the average up and away from both.
The 16 kWh figure therefore describes almost no Spanish customer. A manufacturer entering on the strength of it would arrive with nothing to sell the largest group of buyers in the market.
What capacity weighting hides
Most published storage data is weighted by capacity, because capacity registries are what governments and grid operators produce. Weighting that way shrinks small systems. A 5 kWh unit counts for a third of what a 15 kWh unit counts for.
The distortion is large. In Spain, the 5 to 6 kWh band holds about a fifth of installed capacity and close to half of installations. In the United Kingdom, small systems are roughly twice as significant by unit as the capacity figures suggest.
A cliff averaged into a slope
The Australian data also shows why the reporting interval matters as much as the measure. The quarterly average records a fall of about a tenth, which reads as mild softening. The quarter containing the change also contains a month of installations made under the old rebate, so the drop is smoothed away.
An annual view is worse. It blends eight months of one market with three months of a different one and reports the year as growth. Only the monthly series shows a national product mix inverting inside thirty days.
In defence of the average
Averages have a legitimate job. Capacity-weighted figures are the right basis for forecasting cell demand and grid impact, they are cheap to gather, and they compare cleanly across borders. Every serious storage forecast uses them.
The harder objection is practical. No manufacturer can build a separate range for six countries, and few would want to. Knowing which markets are concentrated and which are split is what tells you where one product covers most of the demand, and where it covers a fraction.
Three questions worth asking
The cost of getting this wrong is measurable. Stock ordered against the old Australian distribution is aimed at a segment that has moved. Sales targets built on it assume customers who are now buying something else. Competitors watching the distribution repositioned in May.
So there are three questions worth putting to whoever supplies your market data. What does the distribution behind this average look like? What do the unit counts say next to the capacity figures? Can I have both monthly?
There is a broader point for the industry. Storage data has largely taken the shape that registries and rebate schemes happen to produce, and commercial decisions have been made in that shape ever since. Markets are now moving faster than the instruments used to measure them.
Warwick Johnston will be presenting on the UK residential battery market at Solar & Storage Live UK in Birmingham, including how UK system sizes and attachment rates compare internationally.
About the data
These figures come from SunWiz Luminate’s verified sample of installation activity, drawn from hundreds of installers in each market and refreshed monthly. Coverage varies by country: balcony solar is absent in Germany, new-build solar is absent in the United Kingdom, and the Spanish sample includes commercial systems. The Australian chart uses installation month; the cross-country series use a blended date basis that smooths sharp transitions.