
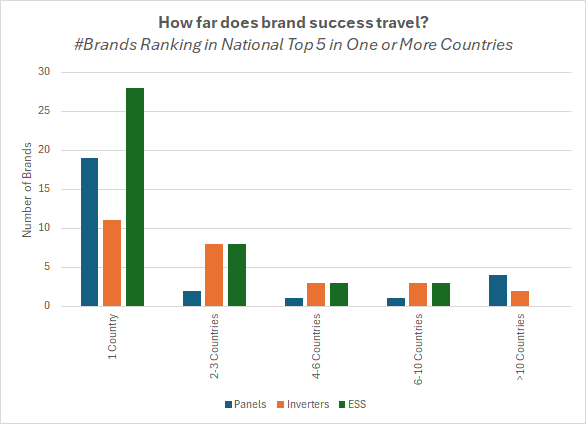
Four panel brands rank in the top five of more than ten countries. Two inverter brands do. No battery brand does — despite batteries having half again as many brands competing.
The industry talks about leading manufacturers as though leadership were a property of the company. Brand X is a top-tier panel manufacturer. Brand Y is a leading inverter supplier. The phrasing implies something global and durable.
Installation data says otherwise. Across 18 markets and three product categories, the pattern is consistent and uncomfortable: for most manufacturers, market position is a local fact, not a global one. Success in one country turns out to be a poor predictor of success in the next.
But it isn’t equally true of every technology, and the differences are where this gets useful.
How to read this chart
It counts something slightly unusual, so it’s worth a moment.
Each bar counts brands, not countries.
The horizontal axis groups brands by how many countries they reach a top-five position in. The vertical axis is how many brands fall into each group.
So the tall green bar on the left means 28 battery brands hold a top-five position in exactly one country. The blue bar at the far right means four panel brands hold a top-five position in more than ten countries.
To make that concrete, here is how a handful of manufacturers would collapse into those bars. The figures are illustrative rather than actual:
Manufacturer | Countries where top 5 | Falls in bucket |
Brand A | 14 | >10 countries |
Brand B | 8 | 6–10 countries |
Brand C | 5 | 4–6 countries |
Brand D | 2 | 2–3 countries |
Brand E | 1 | 1 country |
Brand F | 1 | 1 country |
Brand G | 1 | 1 country |
Brands E, F and G sit together in the leftmost bar. Brand A sits alone at the right-hand end.
What the shape tells you. A tall left side means fragmentation: most brands are local. A populated right side means brands genuinely travel. And the totals matter as much as the distribution — how many brands reach a national top five at all is a measure of how contested a technology is.
Three technologies, three different shapes
Start with the headline counts. Across our markets, 27 panel brands, 27 inverter brands and 42 battery brands reach a top-five position somewhere.
Panels and inverters have the same number of brands in play. They distribute completely differently.
Panels are bimodal, and strikingly so. Nineteen brands appear in a single country. Then the middle nearly empties — two brands at two or three countries, one at four to six, one at six to ten. And then four brands above ten countries, making that the second-largest panel bar on the chart.
There is no gradual decay here, and no meaningful middle class. In panels you are either a single-market brand or you are close to global, and almost nobody occupies the ground between. Of the eight panel brands that appear in more than one country, half are in more than ten.
Inverters are the only smooth distribution. Eleven brands in one country, eight at two or three, three at four to six, three at six to ten, two above ten. A genuine continuum of partial travellers at every stage.
Batteries are the most crowded and the least mobile. Twenty-eight brands in a single country — more than any other technology has in total across every bucket except one — then eight, three, three, and zero above ten countries.
So the technology with the most brands competing has no brand that has travelled widely. Panels, with the fewest brands, have the most.
Most brands never leave home
The largest group in every category is brands present in exactly one market. In panels that’s 19 of 27 brands. In batteries, 28 of 42.
This is not a story about small or marginal suppliers. These are brands that have reached the top five of a national market — they have won distribution, cleared certification, built installer relationships and taken meaningful share. They have simply done it in one place.
For anyone benchmarking competitors, this matters more than it first appears. The competitive set you face in one market is substantially not the competitive set you face in the next. A brand tracker built on a single market describes that market and very little else.
Leadership is a fixed pool, and hardly anyone is in it
Reaching a top five in many countries is one achievement. Leading them is a different one, and it scales far less readily — for a reason worth being precise about.
Across 18 markets there are 90 top-five positions available. There are only 18 leadership positions. Reach is close to unlimited; leadership is a fixed pool that brands take from each other directly.
Measured against that pool, the ceilings look different:
Widest presence | Most markets led | Share of all leadership positions | |
Panels | 16 of 18 countries | 5 | 28% |
Inverters | 13 of 18 countries | 7 | 39% |
Batteries | 9 of 18 countries | 4 | 22% |
One inverter brand holds nearly 40% of every national leadership position in this dataset. No brand in any category comes close to converting its presence into leadership at the same rate.
And very few brands lead anything at all.
Of the 27 panel brands reaching a national top five, eight lead a market. Of 27 inverter brands, ten do. Of 42 battery brands, also ten.
So the conversion rate from presence to leadership runs 37% for inverters, 30% for panels, and 24% for batteries — the most crowded field and the hardest to convert.
That gap separates two things the industry routinely conflates. Being available, specified and stocked widely is one thing. Being the brand installers reach for first is another. It is entirely possible to be nearly everywhere and dominant almost nowhere, and several brands are.
Why leadership stays local
Nothing here implies these brands are underperforming. It reflects what actually determines position in this industry.
Distribution is local. Wholesalers carry different portfolios in different countries. An installer cannot specify what is not easy to buy, and shelf position has to be won separately in each market.
Installer relationships are local. Loyalty is built through training, technical support, warranty handling and the accumulated experience of jobs that went smoothly. None of that transfers across a border.
Compliance is local. Grid codes, safety standards and certification regimes differ by country, and they differ most for the products carrying the most electronics.
Product fit is local. The battery size that dominates one market is not the size that dominates another — modal system sizes vary by more than a factor of two across the markets we track. A range optimised for one country’s typical installation is mis-specified for another’s.
Service obligations are local. A ten-year warranty is a promise to have someone in that country in ten years’ time. Building that is slow and expensive, and it is usually what limits how many markets a brand can credibly serve at once.
Each of those layers is thinnest for panels, which are close to a commodity, and thickest for batteries, which add protocol compatibility, safety certification, installer training and a decade-long service obligation. That ordering is exactly what the chart shows.
What this means commercially
If you are planning international expansion, your position at home is weak evidence about your prospects abroad. Reference customers, brand recognition and category leadership carry less into the next market than most entry plans assume — and least of all in storage.
If you are benchmarking competitors, a single-market view will systematically mislead you. Around seven in ten of the brands you compete against at home do not compete against you anywhere else, while brands that barely register in your market may be leading several others.
If you are in storage specifically, the competitive picture is the most fragmented of the three technologies and the least consolidated. Forty-two brands reaching national top-five positions, none of them widely travelled, means the field you face is largely rebuilt every time you cross a border.
And if you are assessing your own performance, the distinction between reach and leadership is worth measuring separately. Being present in more markets and being stronger in the markets you are present in are different achievements requiring different investment. Conflating them under “market share” hides which one you are actually buying.
About the data
Based on SunWiz Luminate’s verified sample of installation activity across 18 markets, drawn from installer-level records and refreshed monthly. Brand positions reflect top-five ranking by installation volume within each national market.
Counts are exact rather than cumulative: a brand appears in one bucket only, according to the total number of markets in which it holds a top-five position.
Manufacturer identities are deliberately excluded. The chart shows only how many brands occupy each level of geographic breadth, not which brands they are.
It is a sample, not a census. Coverage depth varies by country, and within each country some segments are represented more completely than others, which will affect which brands appear in a given market’s top five. The analysis counts distinct manufacturers; where a brand operates under multiple names or sub-brands, these are consolidated where identifiable.