
What does 10 Gigawatts of Solar Power look like?
10 gigaWatts is a bloody big number. And that’s how much solar power is now sitting on Australian rooftops. Converting sunlight into electricity without even moving so much as a piston.
10,000,000,000 Watts. Yep ten billion Watts. It’s almost unfathomable. Remember the old 60W light globes. It’s enough to power 166 million of them.
Still too big a number to comprehend? Hmmm, let’s try another more familiar comparison. The 6 light towers at the MCG together consume about 1800kW. Which means there’s enough solar power on Australian roofs to fill 5,500 MCGs with light.
Let’s try to think of it in more familiar terms. When I started in the solar industry in 2005, the typical system size was 1kW, which was made up of 6x 170W panels and took three blokes a full day to install. If the solar industry hadn’t progressed, then we’d have ten million of them. But thanks to advances in technology plus impressive improvements in labour efficiency, the average system has grown 6-fold in size, and we’ve got 2.25 million Aussie rooftops covered with solar. Over one-quarter of Australian households now host a solar power system.
That 10GW is 10,000 megaWatts. It’s enough to power two-thirds of South Australia’s electricity needs on certain days. Enough to keep the power on across the other side of the country when a coal fired power station fails in a distant state. And enough to save Australian households $4.4 billion per year. Its more than three times larger than Australia’s largest power station (Loy Yang A&B). In more traditional terms, its the equivalent horsepower to 13 million horses, which incidentally is about 20% of the world’s horse population.
That 10GW is made up of 40 million solar panels. That’s astronomical! If you laid them end to end, then you’d reach all the way around planet earth, twice over! Or reach 20% of the way to the moon.
Of those 40 million solar panels currently installed on Australian rooftops, about 6.4 million were installed in 2019 – that’s a breathtaking figure! Its equivalent to one panel installed every five seconds, or three panels installed for every four breaths you take.
No matter what analogy I use, its simply extraordinary to think how big Australia’s rooftop solar installations are. And that’s not even counting the Australian solar farms, which add another 40% (4GW)!
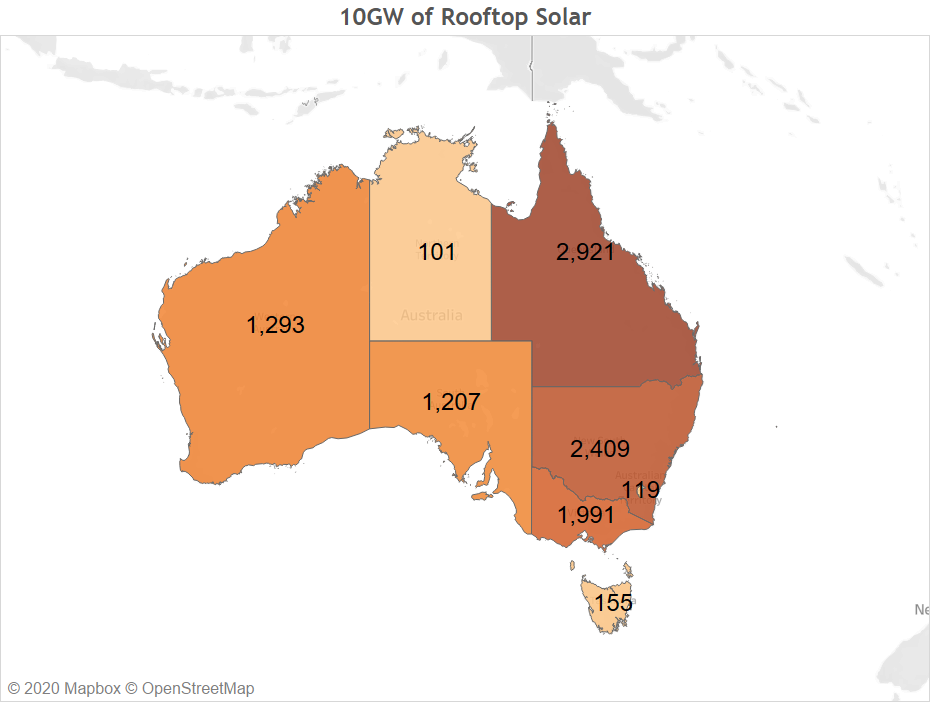
And the Australian rooftop solar market doesn’t look like slowing down. (Which is just as well, as a great way to leverage private funding to reduce carbon emissions and profitably slash electricity bills). 2019 was a record year for Australian rooftop solar nationally, and also concurrently in every mainland state.
SunWiz’s Year in Review reports that 2019 ended on a great note too: December was a record month in every mainland state except Victoria. Which bodes well for a cracking start to solar 2020.
10 years of helping solar businesses navigate the Australian solar landscape has taught me the solar industry is incredibly dynamic. Which makes the 2019 Year in Review essential reading for any solar business that’s looking to grow.
SunWiz has been producing market reports since 2009, and most leading solar businesses are subscribers. If you’re not already an Insights subscriber, you’re missing out on an edge most of your competitors have.
So it makes sense to:
- Buy a 2019 Year In Review ‘The Wisdom” report (comes with complimentary 3-month Insights subscription)
- Subscribe to Insights from $2750 per 6 months
- Subscribe to free market intel from SunWiz