USING LUMINATE TO IDENTIFY HOW & WHY JINKO IS AUSTRALIA’S #1 PANEL BY VOLUME
This article runs through a demonstration of how luminate can be used to strengths and weaknesses of each manufacturer, enabling reflection of what strategies best succeed in gaining market share. We will use the case of Australia’s #1 Panel Manufacturer by Volume (Jinko Solar) an example.
In it we use many of the newly released features and views we’ve added to the Panels Upgrade in Luminate.
Note equivalent views are available for all major panel manufacturers, and also for inverter manufacturers. Data is updated monthly

Note before we begin
Jinko is #1; the following is a sub-set of data
- SunWiz market share is highly accurate at the brand level
- Much of today’s data utilizes a subset of our data
- Hence the figures shown vary from Jinko’s total
- Should not be interpreted in absolute terms; instead evaluate their customer behaviour trends and relative values
- Jinko is Australia’s #1 solar panel by volume in 2022
retailers by state, again in the high volume retailers article.
Changing of the guard:
OLD CUSTOMERS ARE RETURNING TO JINKO IN 2023, JOINED BY NEW ONES
This view shows factors that drive recent changes in Jinko’s volume – in this case whether retailers are testing their product but not returning, dropping their product, adopting their product for the first time, returning to Jinko after some time apart, or Jinko’s regulars (customers that bought throughout the period).
Jinko’s greatest recent growth comes from the light blue colour – indicating a lot of customers are returning to the product, and bringing significant volumes with them. This return has been sufficient to offset the progressive exit of customers from H2-2022.
Existing customers expanded + new customers added
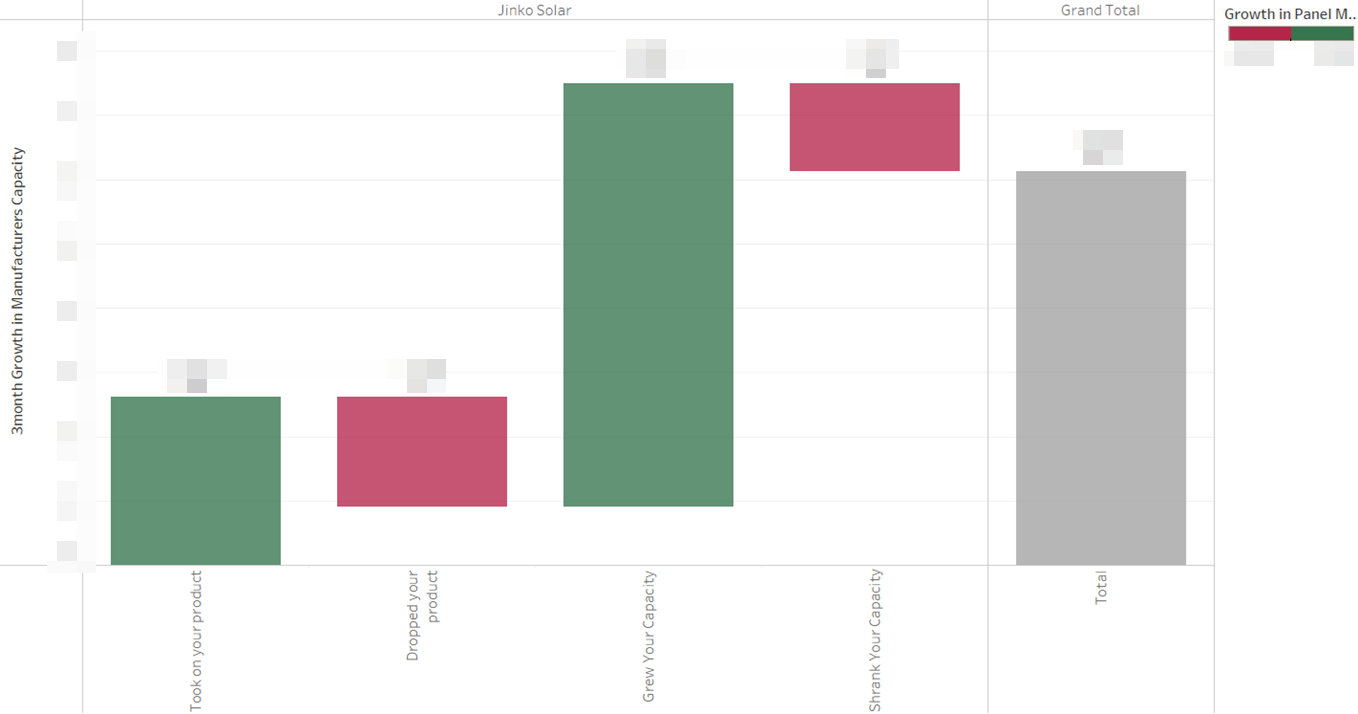
3MONTH CHANGE IN VOLUME BY CHANGE IN RETAILER USAGE OF Jinko
In the last 3 months Jinko’s existing customers dramatically expanded their use of Jinko – plus the volume of new customers was greater than those who were lost.
This view shows factors that drive recent changes in your volume – in this case whether retailers are taking on or dropping your product, or whether they’re increasing or decreasing use of it.
This chart helps answer “are you declining/growing because your retailers are doing less/more of your product, or because retailers are adopting/abandoning your product”. Retailers are classified by their change in volume of your product, comparing the most recent 3-month period to the previous 3-month period. The labels show the change in volume (kW) for the number of retailers included in the data sub-set.
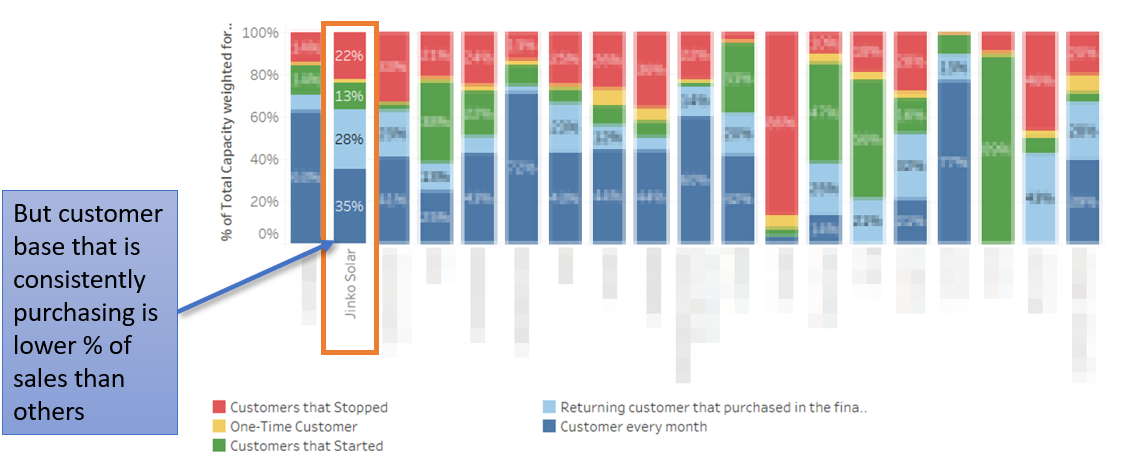
Jinko has highest %volume from Returning customers
CUSTOMER LOYALTY, RETURN, ACQUISITION AND CHURN, LAST 12 MONTH
Compared to other manufacturers, Jinko has highest percentage of volume from customers who returned to the brand.
This view breaks down each manufacturer’s volume in the recent 12 months by customer loyalty characteristics. It highlights the percentage of volume from regular customers, returning customers, new customers, one-time customers, and customers that left before the end of the 12 month period. Use this chart to identify manufacturers that command greatest loyalty, those that are attracting new customers, those whose products are being trialled then dropped, and those who are seeing significant churn.
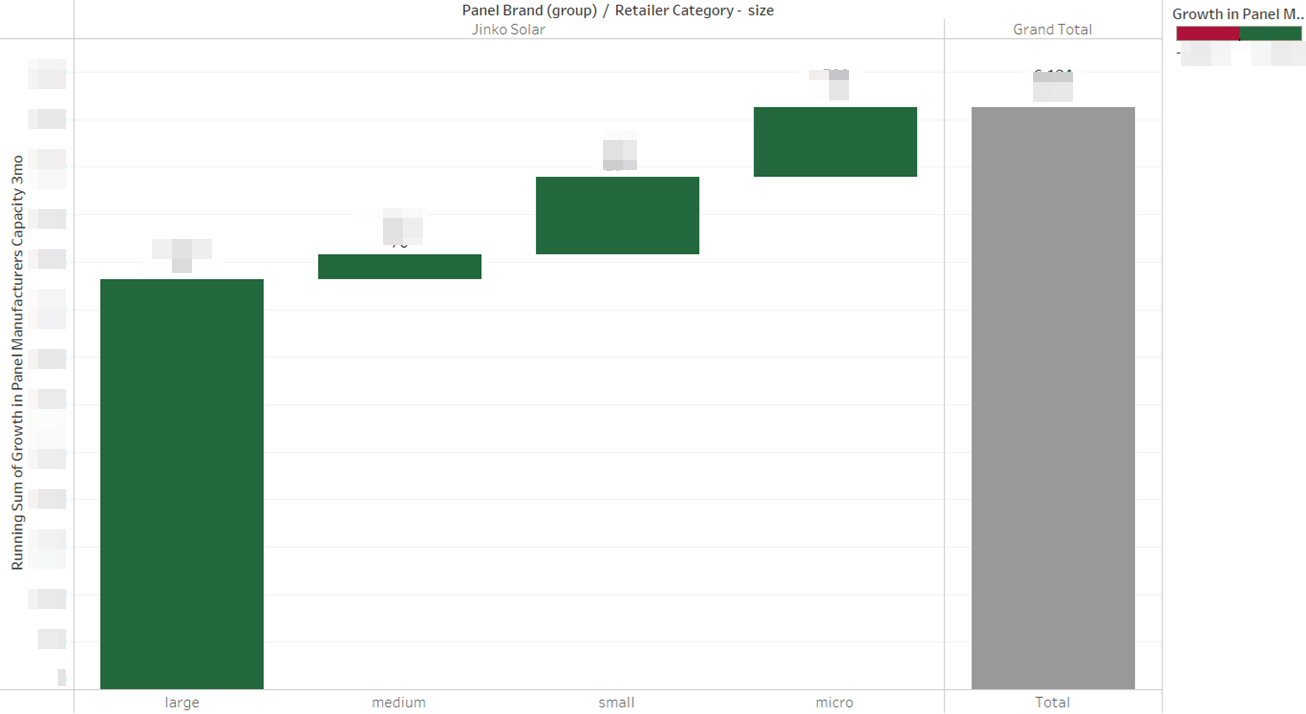
Jinko’s recent growth was driven by large retailers
3month change in volume by retailer size
Jinko’s recent growth was driven by large retailers.
This view shows factors that drive recent changes in the manufacturer’s volume – in this case the size of retailer. Retailers are classified by their overall annual volume of all products. Which customer category has driven gains or losses in this manufacturer’s volume? The time base is the most recent 3-month period, compared to the previous 3-month period. The labels show the change in volume (kW) for the number of retailers included in the data sub-set.
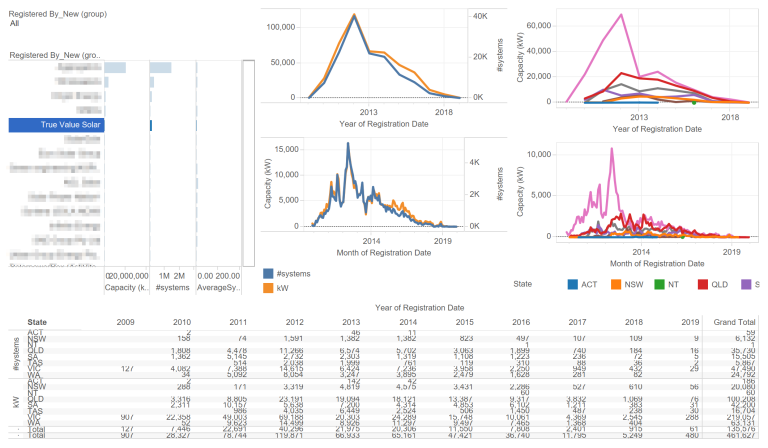
Jinko is increasingly successful due to large retailers
MANUFACTURER MONTHLY VOLUME, BY RETAILER SIZE, RECENT 12 MONTHS
And Jinko is increasingly successful due to large retailers.
This view shows how the manufacturer’s volume has evolved in the recent 12 months, as driven by shifts in uptake by retailers in each size range. Retailers are classified by their overall annual volume of all products. The total volume by retailer size is shown in the upper pane; the lower pane shows the contribution of each retailer size class to the manufacturer’s total monthly volume. Which customer category has driven gains or losses in this manufacturer’s volume?
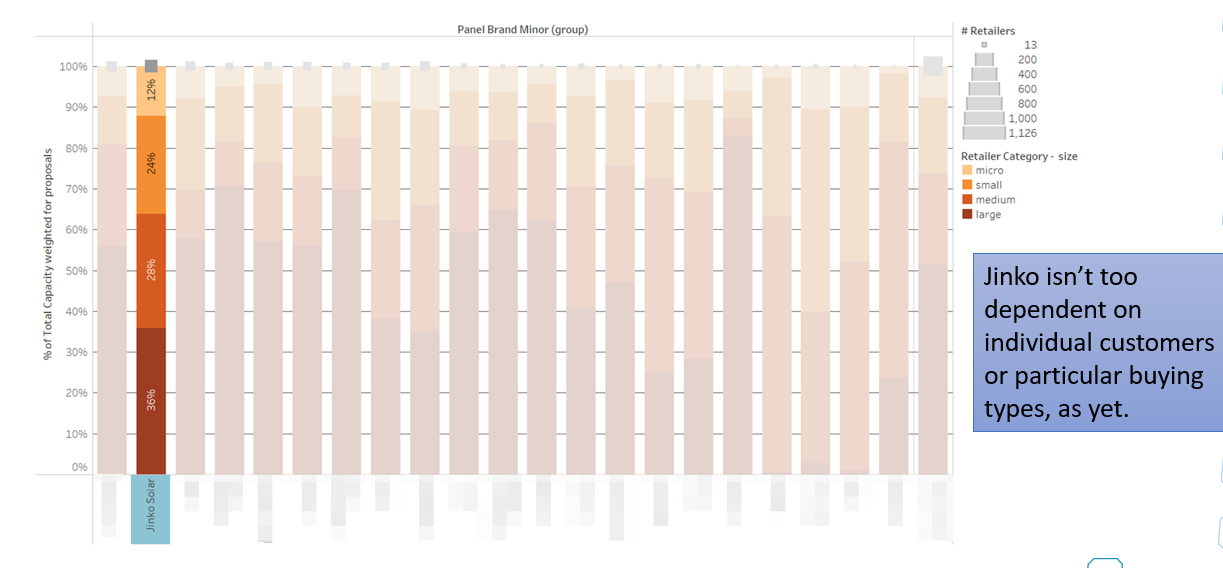
Actually, Jinko has a healthy spread of customers
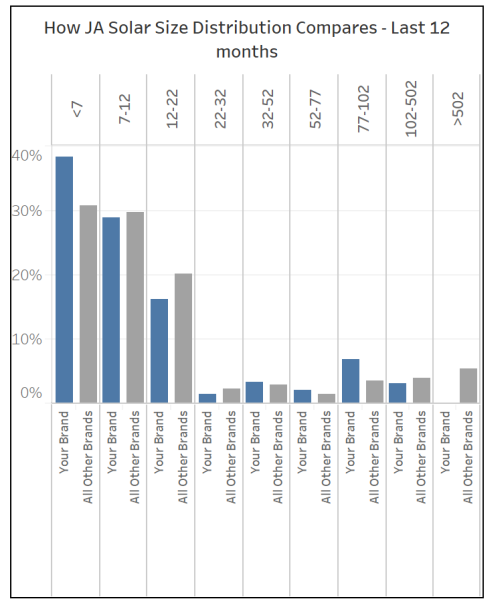
churn / acquisition / loyalty for each manufactuer: #Retailers
Actually its got a healthy spread of customers. In the past 12 months, 36% of its business has been from large businesses, which this image reveals is considerably lower than many other manufacturers.
This chart reveals the distribution of each manufacturer’s business across retailer size segments within the last 12 months.
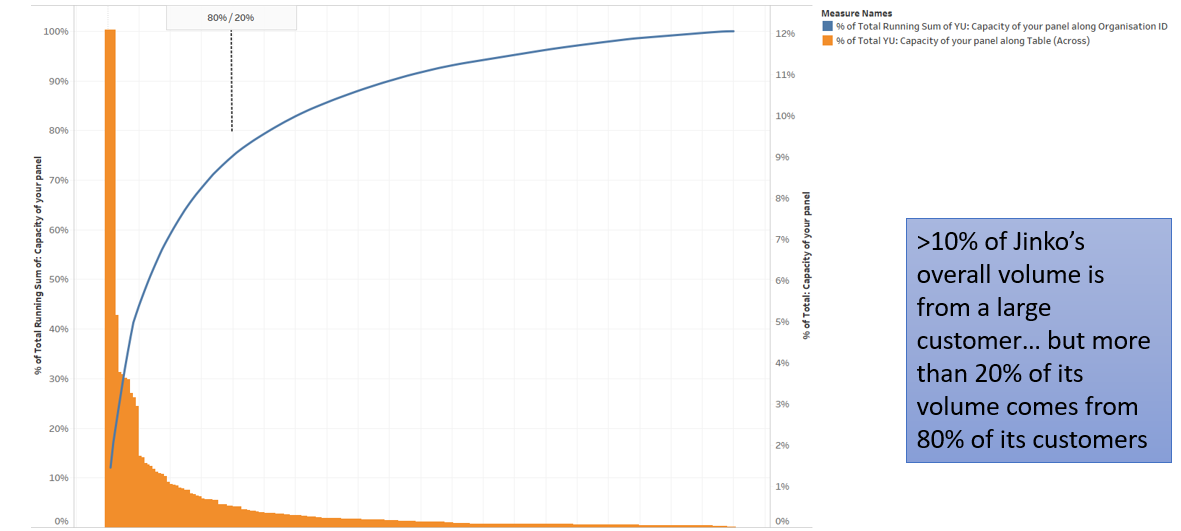
Despite key-customer dependence, it has a very long tail
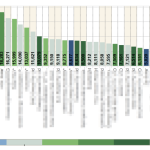
80/20 rule: RETAILER PORTFOLIOS THAT CONTAIN YOUR BRAND
Despite key-customer dependence, Jinko’s pareto distribution of retailers has a very long tail. Jinko could do more to increase its share of large businesses (which it appears it has recently been doing).
This chart shows the proportion of volume utilised by retailers. The dropdown from the 80% y-intercept mark on the blue line represents the % of retailers installing 80% of your volume over the last 3 months.
Customers are embracing Jinko for more of their sales
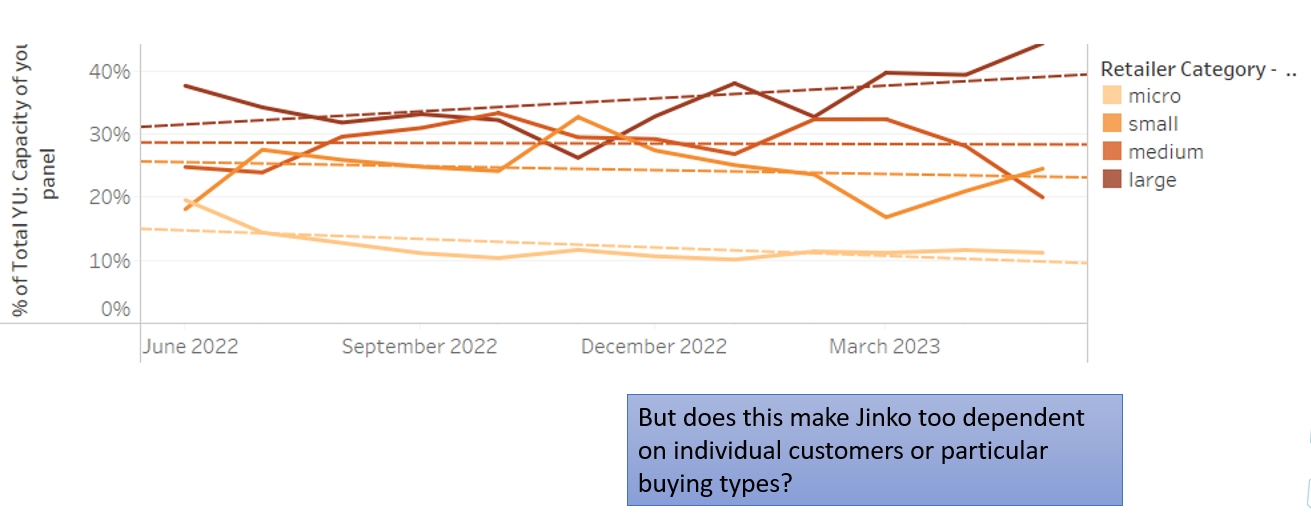
SHARE OF WALLET FOR EACH CUSTOMER CLASS, RECENT 12 MONTHS
| Jinko is capturing an increasing share-of-wallet of large and medium sized retailers. Their share of retailer portfolio is growing amongst large and medium sized retailers: some of Jinko’s growth is from their customers selling their panel more often than others. Jinko’s customers are embracing their product for more of their sales.
This chart helps answer “are you declining/growing because your retailers are shrinking/growing in overall size, or because they’re doing less/more of your product within their portfolio. This view shows the evolution of the manufacturer’s share of wallet within each customer size class, over the recent 12 months. The share-of-wallet tracks your adoption levels within a retailer and is defined as the retailers volume of a specific manufacturer divided by their total volume. A retailer (or retailers) may be doing more of your volume, but you can be missing out on part of their business if your share-of-wallet is slipping. Retailers are classified by their overall annual volume of all products. Which customer category has driven gains or losses in this manufacturer’s volume? |
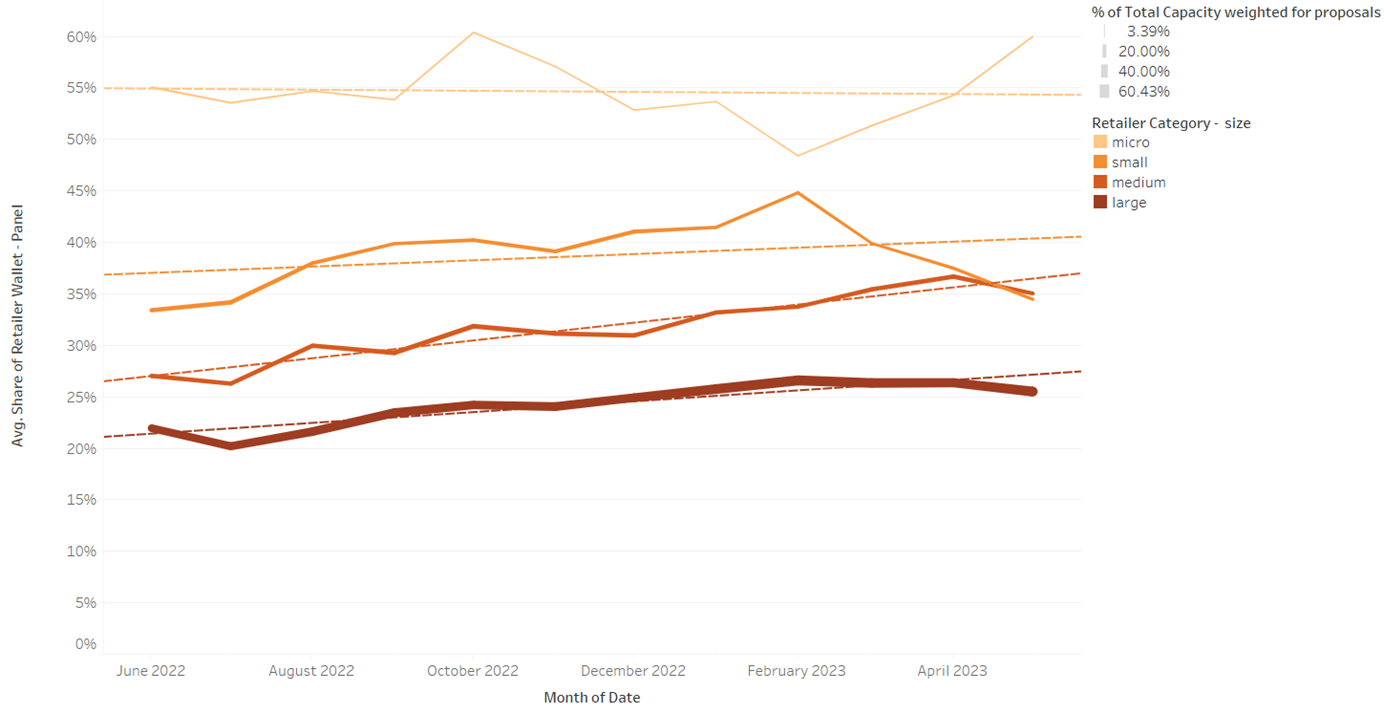
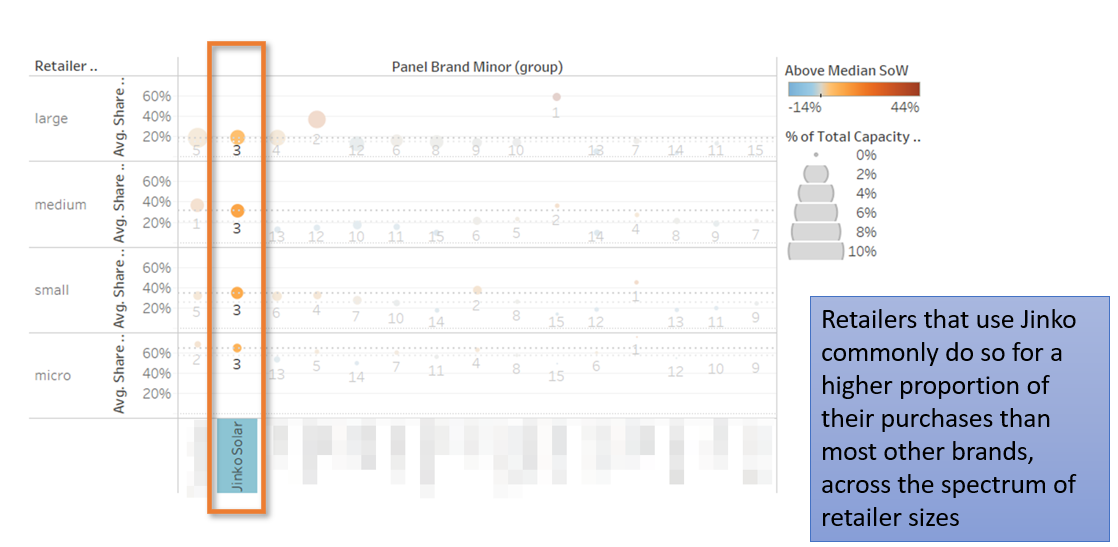
Jinko is well adopted by its users
monthly change in ave retailer’s share of wallet and retailer size
Jinko is well adopted by its users, having the third-best share of wallet in every retailer size class. Retailers that use Jinko commonly do so for a higher proportion of their purchases than most other brands, across the spectrum of retailer sizes.
Numbers show ranking of brand for share of wallet within retailer size classification, vertical axis shows share of wallet, dotted line shows average for each row.
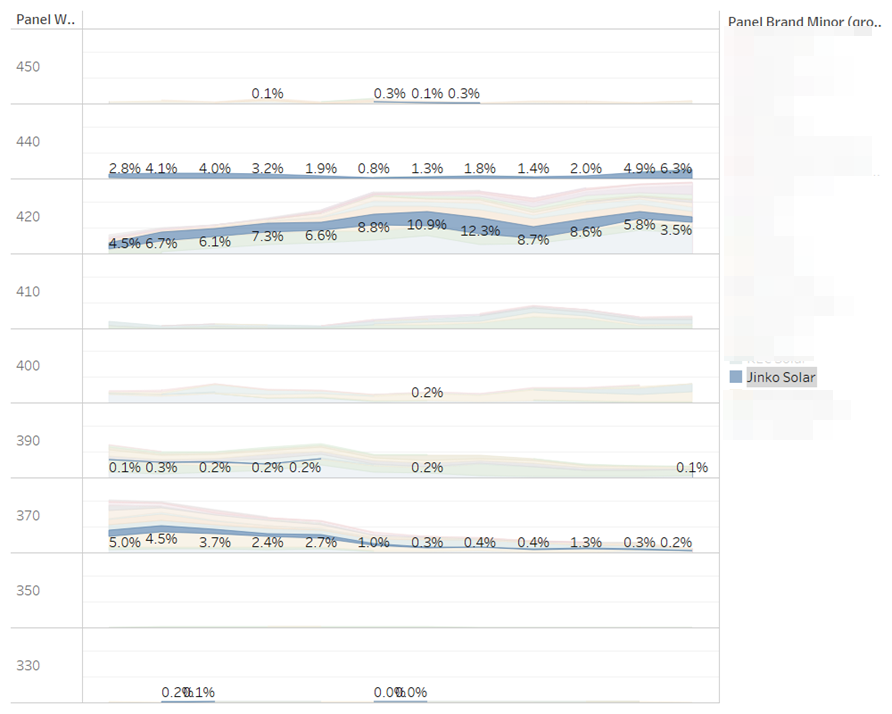
Success is Partly due to dominating the 440W class
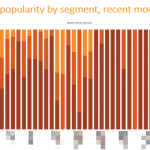
SHARE OF TOTAL MARKET BY MANUFACTURER & WATTAGE
Part of its success is due to product – dominating the 440W class. Most of Jinko’s volume is in the 440-445W class, where it has little competition.
This view breaks down the total market into 10W chunks, coloured by manufacturer. It provides a view of which manufacturers are dominating each wattage class, and the importance of that wattage class to the entire market.
Success despite being sold in more-expensive systems
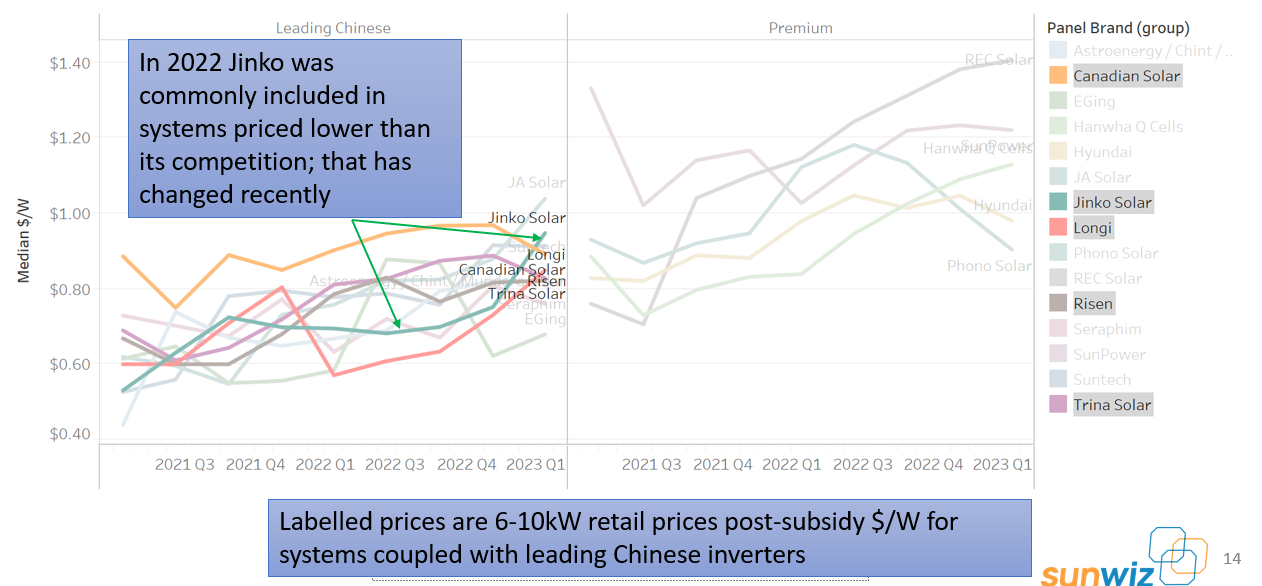
PRICE PREMIUM FOR EACH PANEL BRAND
Jinko’s success appears to be despite being sold in more-expensive than other panels.
Labelled prices are 6kW retail prices post-subsidy $/W, bar length & colour show price relative to the median price of the table.
Panels with blue bars trade at the greatest discount to the median; inverters with brown bars trade at greatest premium.
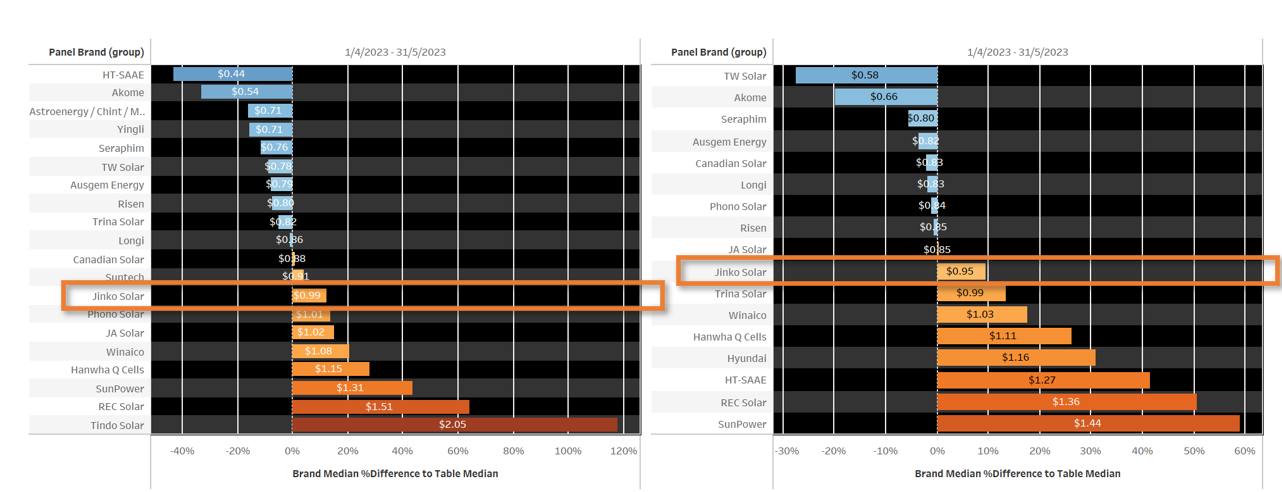
Jinko was far cheaper but now far dearer
SHARE OF TOTAL MARKET BY MANUFACTURER & WATTAGE
Though this higher-price is a recent phenomenon – it has switched from almost cheapest to almost dearest amongst its competitors. In 2022 Jinko was commonly included in systems priced lower than its competition; that has changed recently.
Recent price shift may explain Jinko’s slipping share
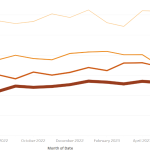
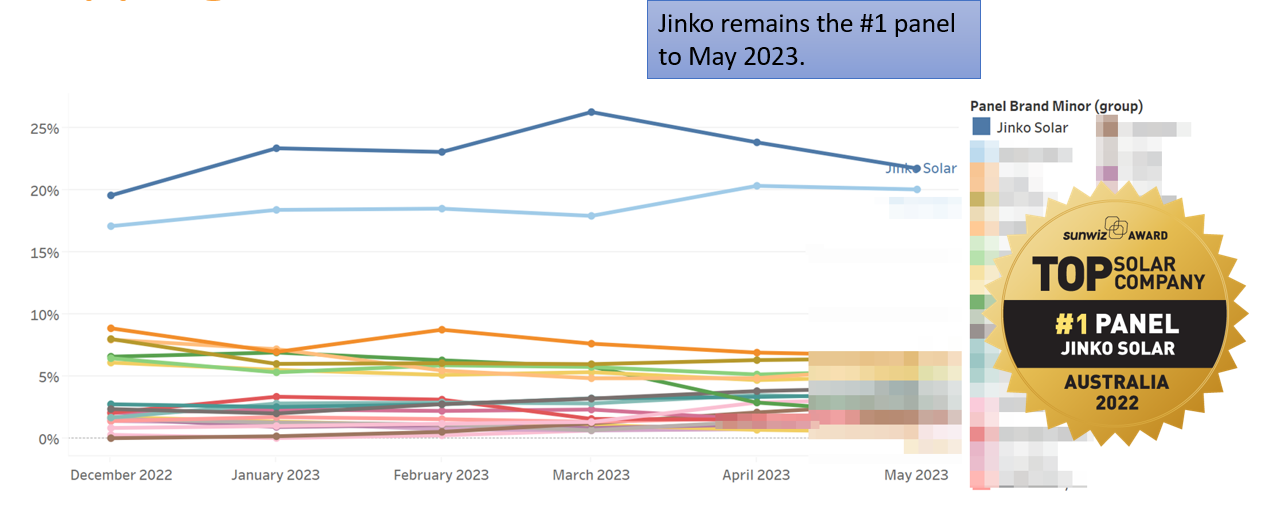
MONTHLY TREND IN MARKET SHARE BY MANUFACTURER – LAST 6 MONTHS
Though Jinko remains the #1 panel to May 2023, their market share has been slipping. This may be explained by the relative price rise.
This chart shows the trend in the market share each panel manufacturer holds within the total market over the last 6 months broken down by month.
More information available on each manufacturer
Upgrade to Panel / Inverter bundle today
More information is available on each panel and inverter manufacturer, including:
- Trends in volumes of other products for retailers that use Jinko
- Segment share of business
- Share of state
- Retailer size vs Share-of-Wallet
- Commonly-coupled panels & inverters
- Other panels Jinko commonly encounters in retailer portfolios
- PLUS: Manufacture share of Nation, Segment, and State + trends updated monthly