
SWOT Assessing your Competition – Panel & Inverter Manufacturers in the Australian PV Industry
Plenty of panel and inverter manufacturers have a good grasp on their own business. Many have loyalty programs or direct relationships with their key retailers, and collect feedback via a number of channels. This can give a fair understanding of your own business.
But its practically impossible for manufacturers to have the same level of understanding about their competitors. UNLESS you subscribe to Luminate.
In this article we’ll show you how to use SunWiz Luminate to assess any panel or inverter brand’s: Share of segment, share of state, retailer dependency, customer loyalty/churn/adoption, customer contraction/departure, size of customers, share-of-wallet, share-of-portfolio, product substitution, and more.
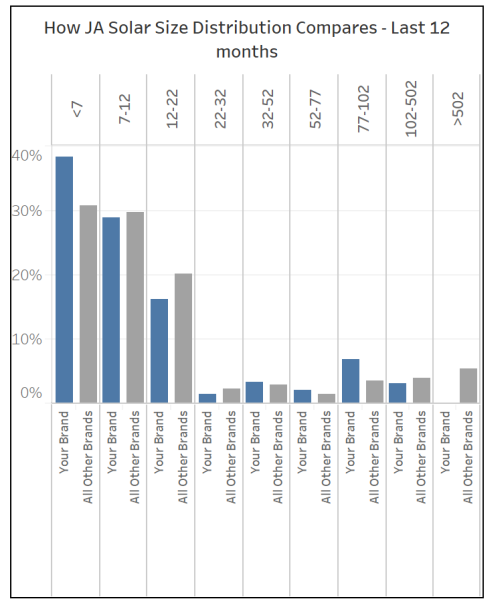
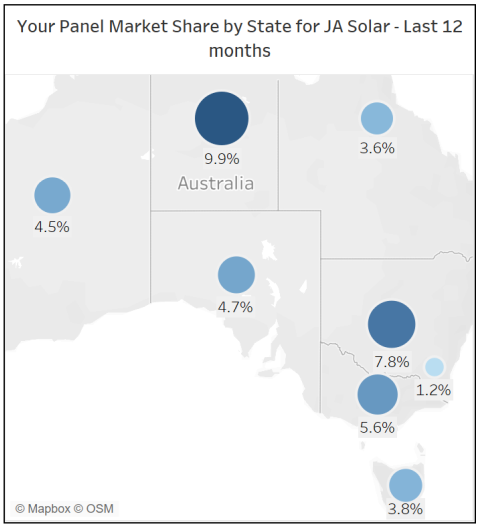
SWOT Assess your competitor – segment & State
Variance of share of business / market by segment (L) & State (R)
These charts, available to those with access to Panel Brand Assessor – Interactive (a similar view exists for inverters), shows (Left) the distribution of installations by segment for the selected manufacturer compared to all other manufacturers (combined). The right pane shows the manufacturer’s share of each state.
Use these charts to identify the strengths and weaknesses of your competitors within segments of interest – this can reveal product advantages that you could exploit/address.
Use these charts to identify the strengths and weaknesses of your competitors within states of interest – this can highlight how distribution strategy or product advantages could be exploited/addressed to gain market share.
Because of this, our industry is characterized by a long tail. In fact, one-third of solar retailers do 5 jobs or fewer each year.
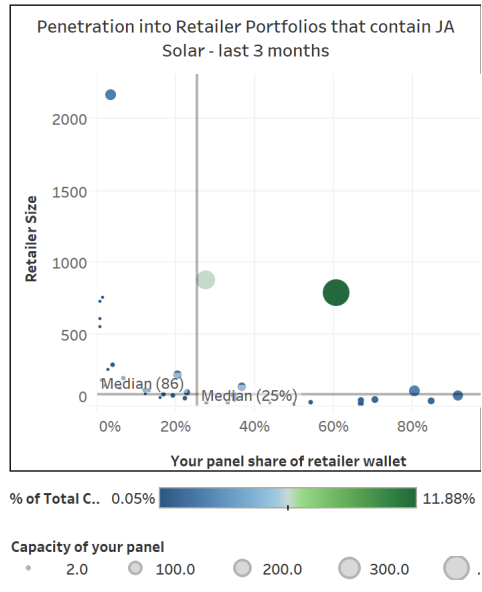
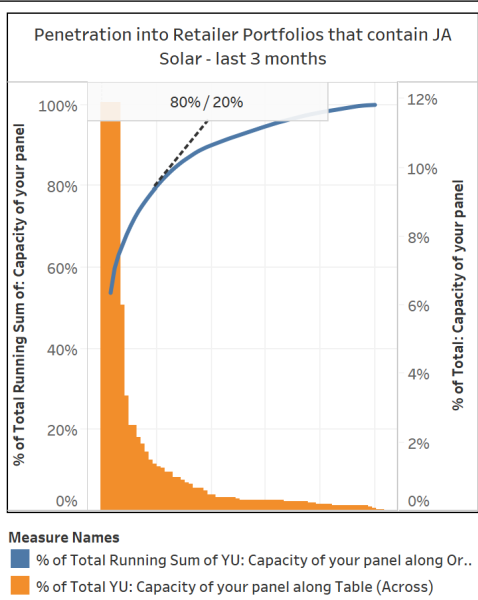
SWOT ASSESS YOUR COMPETITOR – retailer dependency
Share of manufacturer volume (L) + Share of Wallet (R) by retailer
These charts, available to those with access to Panel Brand Assessor – Interactive (a similar view exists for inverters), shows (Left) the pareto distribution of manufacturer volume by retailer. The right pane the characteristics of the manufacturer’s retailers – their size, the percentage of their business that flows to the manufacturer (share of wallet), and their contribution to the manufacturer’s tally.
Use these charts to identify whether a manufacturer (yourself or a competitor) is critically dependent upon one or two retailers, or whether they are spreading their resources thin across many small players. Typical businesses have 20% of their retailers doing 80% of their volume.
Use these charts to identify how you can increase your own market share by A) increasing your share of wallet for large retailers using your product for a small fraction of their volume, and B) helping grow the businesses that use your product for a high fraction of their volume.
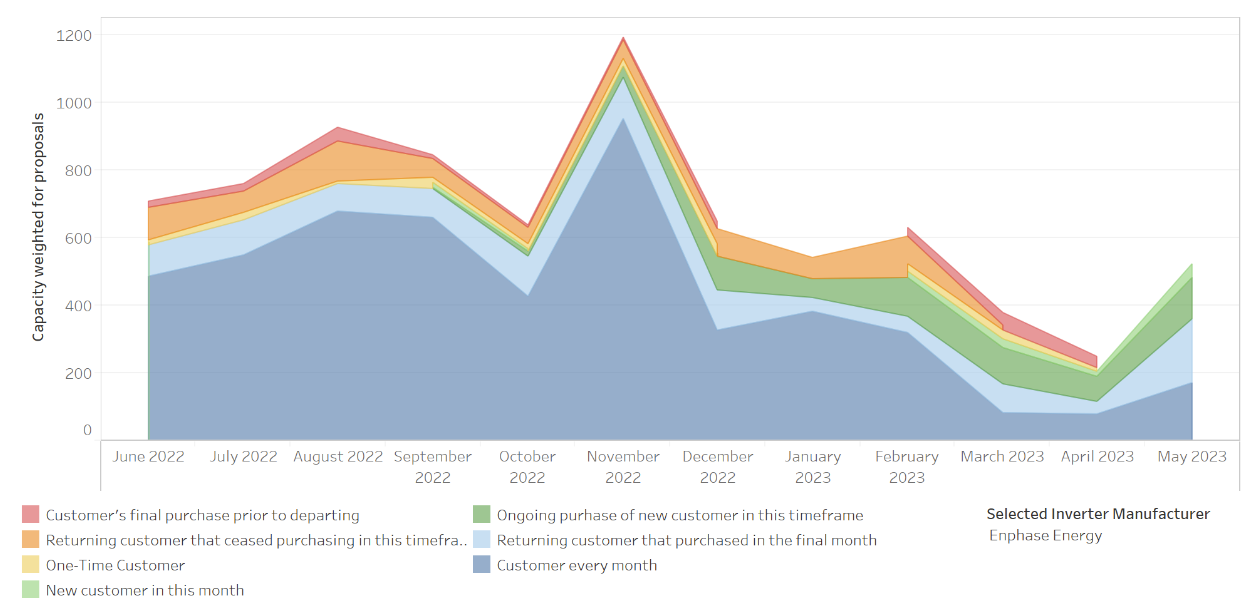
SWOT Assess whether customers are coming or going
3MONTH CHANGE IN VOLUME BY CHANGE IN RETAILER USAGE OF PRODUCT
This chart, available to those with access to Panel Brand Assessor – Interactive (a similar view exists for inverters), shows factors that drive recent changes in a manufacturers volume – in this case whether retailers are testing your product but not returning, dropping your product, adopting your product for the first time, returning to your product, or your regulars (customers that bought throughout the period). This chart helps answer “are you declining/growing because your retailers are abandoning you faster than you’re replacing them” and “are many people not liking your product after their first test”, or “how dependent are my volumes on regular customers” or “are my initiatives to win back past customers working”? The axis show the manufacturer’s volume (kW) for the retailers included in the data subset. The colour shows the retailer’s behaviour with regard to purchasing your equipment.
Look to understand whether a manufacturer is growing or contracting, based on whether customers are coming or leaving. Compare Manufacturers in the Inverter Market Share article. What can you do to stem the flow of customers leaving? How can you attract new customers? How can you entice customers to return? What can be done to increase customer loyalty?
SWOT Assess contraction or departure
3MONTH CHANGE IN VOLUME BY CHANGE IN RETAILER USAGE OF PRODUCT
This chart, available to those with access to Panel Brand Assessor – Interactive (a similar view exists for inverters), shows factors that drive recent changes in your volume – in this case whether retailers are taking on or dropping your product, or whether they’re increasing or decreasing use of it.
This chart helps answer “are you declining/growing because your retailers are doing less/more of your product, or because retailers are adopting/abandoning your product”. Retailers are classified by their change in volume of your product, comparing the most recent 3-month period to the previous 3-month period. The labels show the change in volume (kW) for the number of retailers included in the data sub-set. Track the recent evolution of customer adoption in the chart below. Interpreting this data – Applying this data
What can you do to stem the flow of customers leaving? How can you attract new customers? How can you incentivise existing customers to do more of your product?
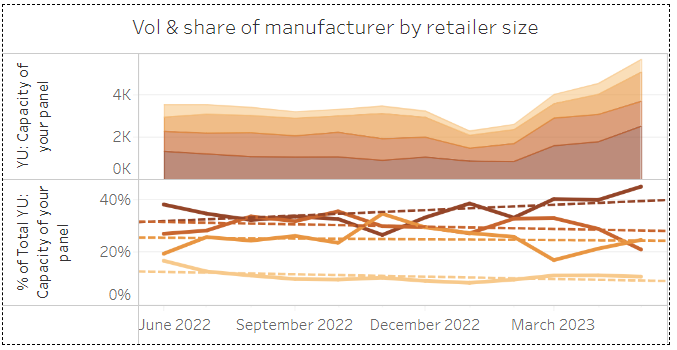
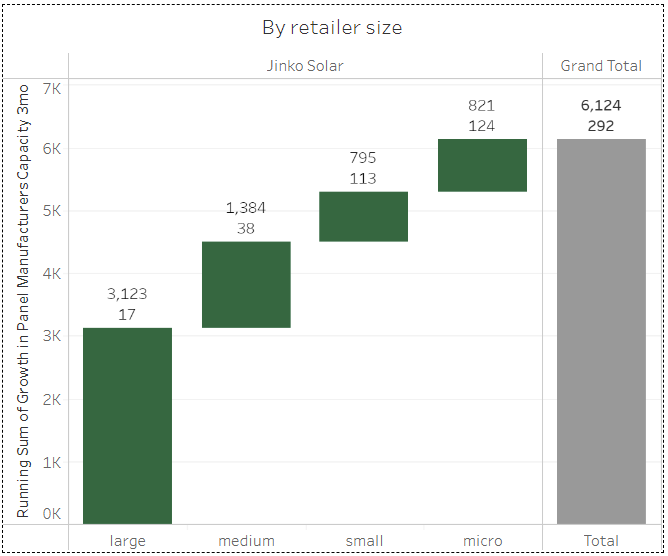
SWOT ASSESS YOUR COMPETITOR – RETAILER SIZE
NTHLY VOLUME BY RETAILER SIZE / 3MO CHANGE IN VOL BY RETAILER SIZE
These charts, available to those with access to Panel Brand Assessor – Interactive (a similar view exists for inverters), shows (Left) how the manufacturer’s volume has evolved in the recent 12 months, as driven by shifts in uptake by retailers as classified by their overall annual volume of all products. The manufacturer’s total volume by retailer size is shown in the upper pane; the lower pane shows the contribution of each retailer size class to the manufacturer’s total monthly volume. The right pane shows a waterfall chart of net movement by retailer size class, comparing the recent 3 months to the previous 3 months.
Which customer category has driven gains or losses in this manufacturer’s volume? Which categories are moving upwards and which ones are falling back? How does this reflect upon the manufacturer’s engagement with end customers? What different strategy is required to reach each customer type?
Use these charts to identify how you can increase your own market share by A) evaluating and contrasting your distribution of customers, and B) improving your strategic engagement with each customer class.
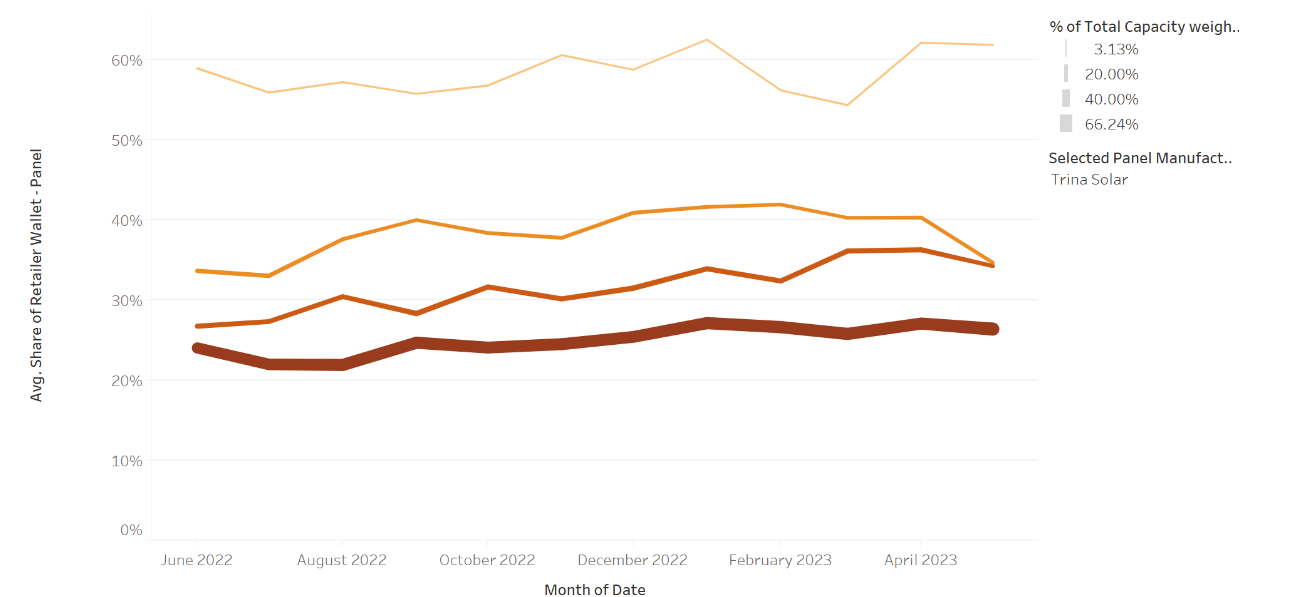
SWOT ASSESS Share of wallet
Is growth coming from more customers or more usage by customers
This view shows the evolution of the manufacturer’s share of wallet within each customer size class, over the recent 12 months. The share-of-wallet tracks your adoption levels within a retailer and is defined as the retailers volume of a specific manufacturer divided by their total volume. A retailer (or retailers) may be doing more of your volume, but you can be missing out on part of their business if your share-of-wallet is slipping. Retailers are classified by their overall annual volume of all products.
This chart helps answer “are you declining/growing because your retailers are shrinking/growing in overall size, or because they’re doing less/more of your product within their portfolio. Consider which customer category has driven gains or losses in this manufacturer’s volume? Compare this manufacturer’s share of wallet by retailer class to all other manufacturers in the Panel Market Share article
SwOT assess your share of portfolio trend
manufacturer market share for retailers using your brand
Overall market share is certainly of interest, as is winning new customers to your brand. It is easier to get existing customers to do more of your product than it is to win new customers.
This chart shows the monthly trend in manufacturer market share for retailers that use your product. If your brand is gaining market share and another brand is losing market share, then its likely that product substitution is occurring. (That can also occur if your retailers are switching between brands other than your own. The next chart more clearly evaluated product substitution to/from your brand aggregated from individual retailers, albeit with a smaller data-set)
Use this chart to quickly view whose fortunes are rising and falling with your own, and which brands rise when other brands fall.
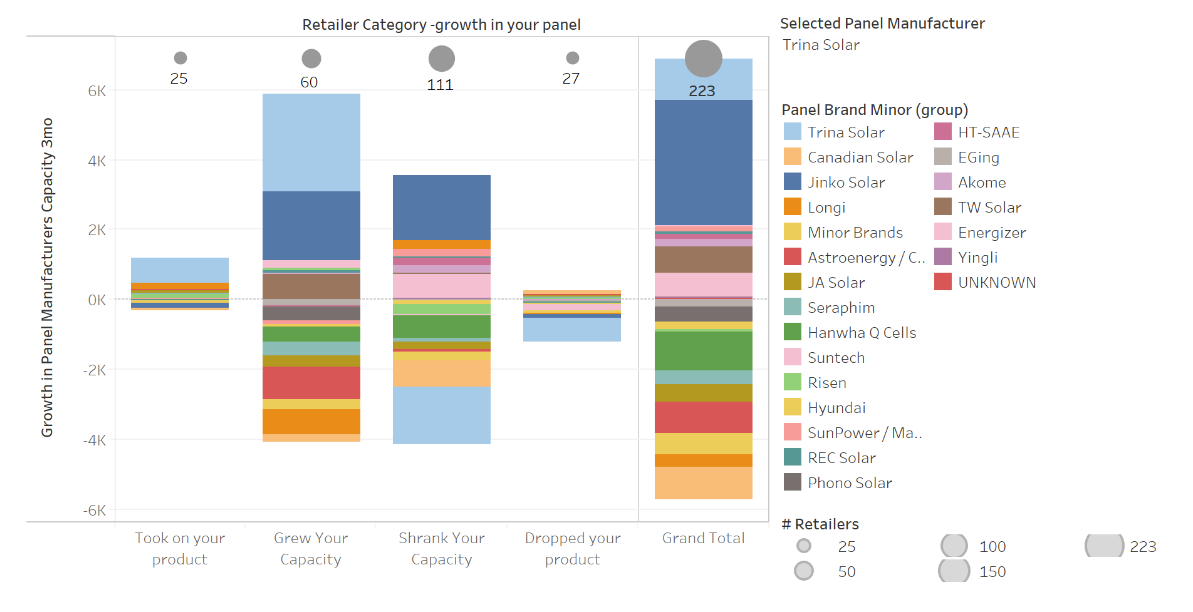
SWOT ASSESS product substitution
who are customers switching to/from this product
This view shows the manufacturers retailers are doing more/less of then whey switch to/from your product or increase/decrease your volume. Your customers may be switching to someone you view as a competitor, or perhaps its surprising whom you’re losing business to. Equally, your efforts to win business from your direct competitor may be revealed in this chart, or you may be surprised whom retailers are preferring your product over.
Retailers are classified by their change in volume of your product, comparing the most recent 3-month period to the previous 3-month period. The bar heights show the 3-month change in volume of product sold by your retailers for each manufacturer.
To identify product substitution at work, contrast changes in the overall volume of your retailers (rightmost bar) to the changes in volume of all manufacturers in the Panel Market Share article; also identify manufacturers with increased volumes for retailers that shrank your capacity / dropped your product AND manufacturers that with decreased volumes for retailers that grew your capacity / took on your product.
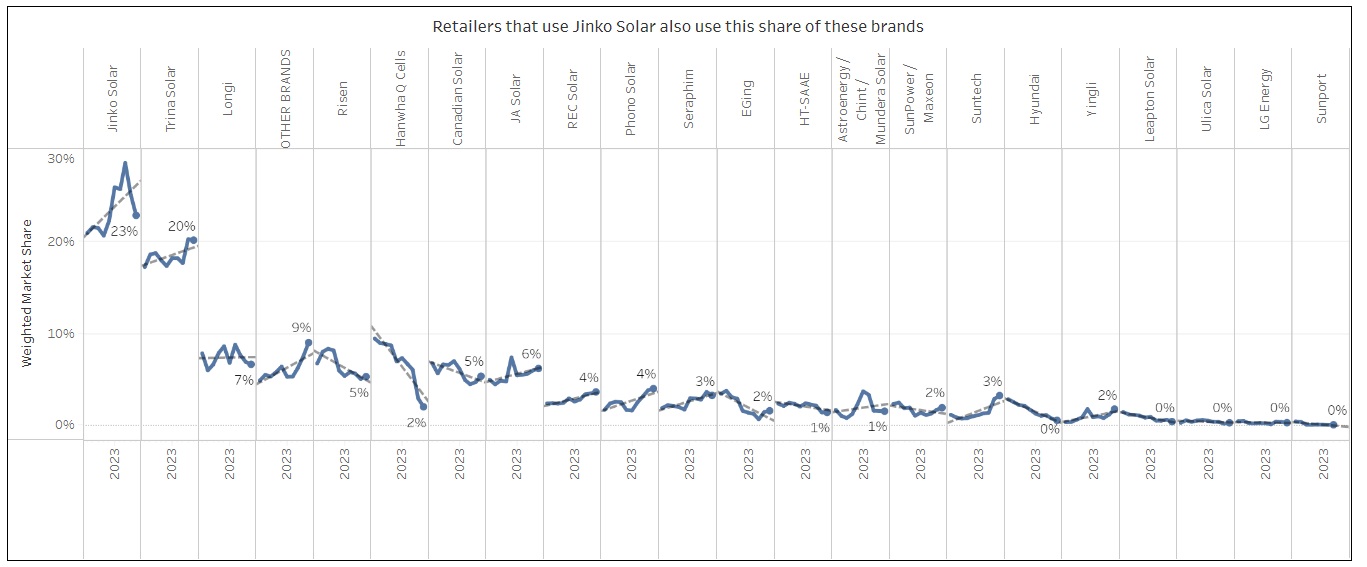
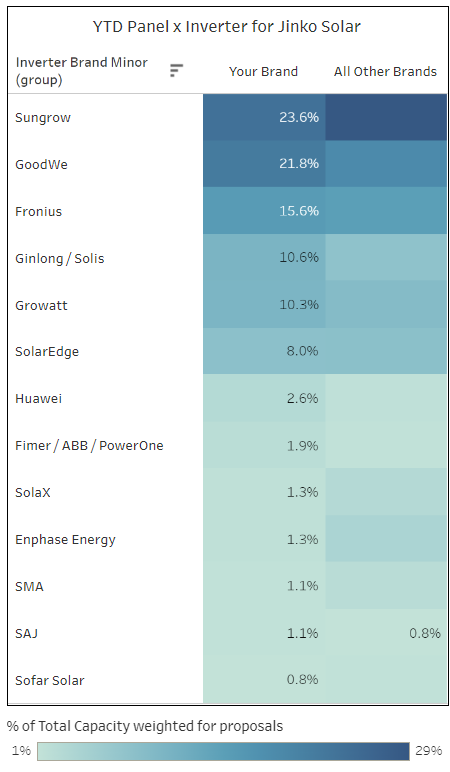
SWOT ASSESS PRODUCT coupling
what does product coupling reveal about your brand value
Understanding how each brand is perceived by the market can provide a competitive advantage.
This view shows the frequency with which inverter brands are coupled with the specified panel brand (an equivalent view is available for inverter-panel coupling), comparing the selected brand with the combined frequency of all other brands. Compare the relative frequency of the specified panel to the rest of the market, to see how frequently you’re coupled to brands that share similar attributes. This table can also be used to identify suitable roadshow partners.
License
Ownership Rights
All reports are owned by SunWiz, protected by Australian Copyright and international copyright/intellectual property laws under applicable treaties and/or conventions. User agrees not to export any report into a country that does not have copyright/intellectual property laws that will protect SunWiz’s rights therein.
Grant of License Rights
SunWiz hereby grants user a personal, non-exclusive, non-refundable, non-transferable license to use the report for research purposes only pursuant to the terms and conditions of this agreement. SunWiz retains exclusive and sole ownership of each report disseminated under this agreement. User agrees not to permit any unauthorized use, reproduction, distribution, publication or electronic transmission of any report or the information/forecasts therein without the express written permission of SunWiz. Users purchasing this report may make a report available to other persons from their organization at the specific physical site covered by the agreement, but are prohibited from distributing the report to people outside the organization, or to other sites within the organization.
Disclaimer of Warranty and Liability
SunWiz has used its best efforts in collecting and preparing each report. SunWiz its employees, affiliates, agents, and licensors do not warrant the accuracy, completeness, correctness, non-infringement, merchantability, or fitness for a particular purpose of any reports covered by this agreement. SunWiz, its employees, affiliates, agents, or licensors shall not be liable to user or any third party for losses or injury caused in whole or part by our negligence or contingencies beyond SunWiz’s control in compiling, preparing or disseminating any report or for any decision made or action taken by user or any third party in reliance on such information or for any consequential, special, indirect or similar damages, even if SunWiz was advised of the possibility of the same. User agrees that the liability of SunWiz, its employees, affiliates, agents and licensors, if any, arising out of any kind of legal claim (whether in contract, tort or otherwise) in connection with its goods/services under this agreement shall not exceed the amount you paid to SunWiz for use of the report in question.