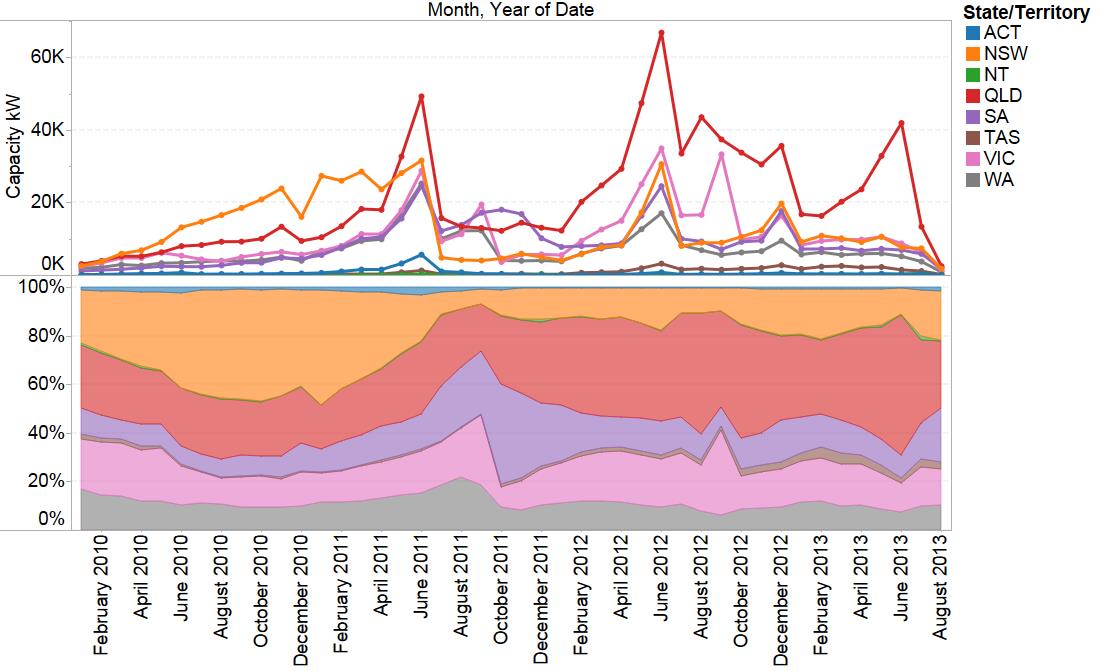
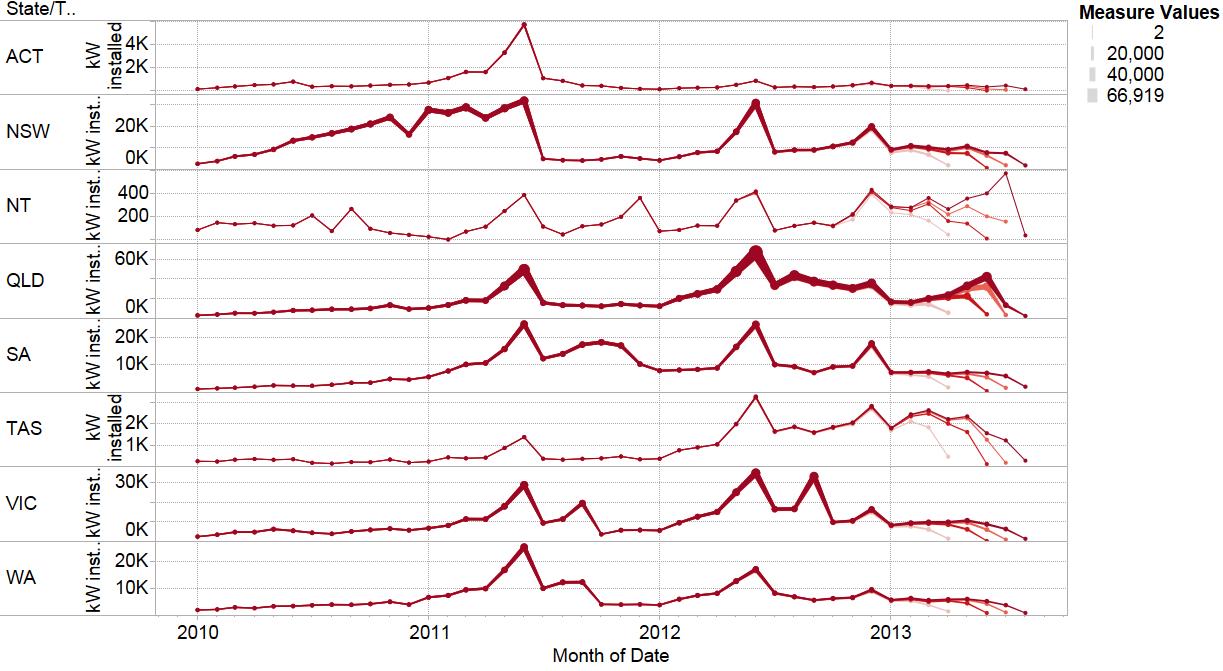
Solar Mourns Queensland & September Synopsis
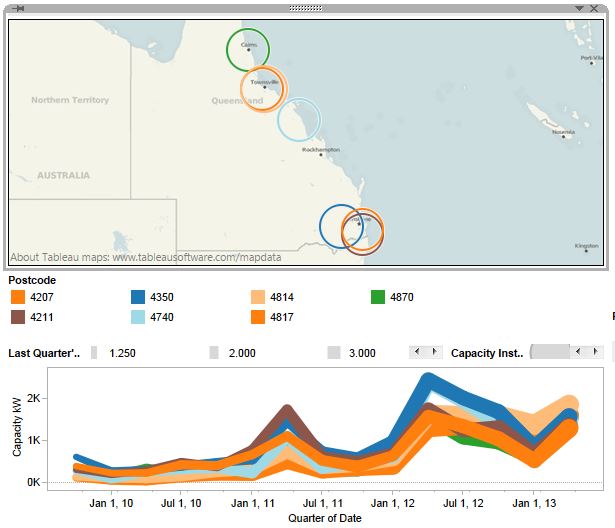
QLD responsible for Australian Solar Slowdown; Hotspots: where it happened; Clearing House to move; Sunny’s new haircut
Australia’s Solar Industry mourns the loss of Queensland
Across the nation, many solar businesses are feeling the pinch. Not for the first time, business models are being readjusted. The end of feed-in tariff supported installations in Queensland means that the Australian solar industry has been wound back by 25%-33% overnight. Once the SA feed-in tariff is wound back, Australia will enter a new phase – one of overall stability but flat profitability. Businesses that succeed in this new market will be those that optimise their sales and marketing expenditure through targeted marketing and commercial sales.
Previously solar businesses had to face overnight halts to installations as feed-in tariffs closed, then figure out how to cover overheads as the cost of systems plummeted. But the latest release of installation data from the Clean Energy Regulator (CER) reveals the impact of the closure of the Queensland 44c/kWh feed-in tariff. The graph above shows the monthly installation tally according to CER data releases in recent successive months, with the most recent releases shown in darker colour. When interpreting the graph, its important to correctly interpret the apparent turn down in the most recent two months since any data release, as systems can take 12 months from installation to appear in the dataset. For example, June’s installation figures appeared to be 7MW when June’s data was released, which jumped to 57MW when July’s data was tallied, and then to 73MW when August’s data was tallied.
However, the most recent data set is different. It shows the second-last data point to be a 45% reduction on the third-last data point. This implies a distinct plunge in installations occurred in July. Even though the actual plunge is likely to be less than a 45% reduction, such plunges previously only occurred when nationally-simultaneous incentive wind-backs (i.e. multiplier reductions) occurred – in which case installation volumes truly fell by 67%. The reason for this recent downturn is the loss of the Queensland market, (which represented 50% of the market nation-wide, and 67% of the market in June). The graph below shows the national data broken out by state. Note that the axes are independent for each state, but the thickness of the line (also showing capacity installed) is consistent across each state. We can see that there was a massive turndown in June in Queensland , but there has also been a consistent slide in Tasmania since June. In spite of the downturn in Queensland, the data in WA, Victoria, SA, NSW, and the ACT shows remarkable month-on-month consistency.
The lower sheet shows information from the most recent CER data release. It identifies the overall market stability over the first half of the year; the exception being the Queensland market. Interestingly it is SA that has gained market share in the second half of 2013, which is the likely result of the closure of its feed-in tariff. However, SA hasn’t responded to its feed-in tariff closure to the extent that it responded to a previous wind-back in September 2011, and certainly it is not enough to offset the loss of the Queensland market. Meanwhile NSW is regaining some market share – NSW being the state that best figured out how to sell solar without a Feed-in Tariff
Once South Australia’s feed-in tariff is wound back, the solar industry will face a new phase of the solar industry evolution, that of general market stability but flat profitability for the average business. The best strategy to employ during this new phase is to focus business expenditure towards optimal return on investment in sales acquisition, both in residential and commercial sales. Recently, three major Australian PV retailers have approached SunWiz to perform analysis on how their market share is evolving on a regional/postcode basis. This has highlighted areas they are doing well and opportunities to replicate this success in other growth regions, and identified opportunities that they are missing out on – growth areas where their market share is slipping or non-existent. These businesses can now target their marketing towards regions where they are most likely to successfully convert sales, thus maximising their ROI on their customer acquisition costs. Similarly, using PVsell to rapidly identify whether commercial leads are worth pursuing has allowed their sales staff to concentrate on commercial opportunities that are most likely to bear fruit. This educational outcome from PVsell use can mean the difference between a commercial sales operation that is highly profitable and one that drains resources.
Even without incorporating your solar business’ market share analysis, SunWiz’s Solar Hot Spots interactive opportunity identifier can be used to find opportunities for growth. The image below provides a generic example by identifying where the most volume and greatest growth occurred in Q2 of 2012 – the quarterly installation figures for each postcode is shown below. Unsurprisingly this was in Queensland, with record Quarters occuring in Cairns, Mackay, and two suburbs near Townsville, plus very strong figures for Toowoomba and two suburbs south of Brisbane. Other noteworthy Q2 statistics are included in the section below.
And yes we will see you at All Energy. Indeed, we will be giving PVsell demonstrations and training at 10:30am and 3:00pm each day Melbourne Convention & Exhibition Centre Hospitality Suite 2.204.
PV Market
- 74 MW of PV was registered in August, a slight fall from July’s figures.
- Registration grew markedly in SA, but still not to the extent of two years ago when their FiT was first wound back
- 7.5% of systems in SA were in the 10-30kW range in August
- For the first time since we started tracking SolarChoice retail pricing, system prices have risen across the board (every system size)
Want more information? Subscribe to Insights
STC Market
- STC prices fell back a little last week.
- The Clearing House could move a small amount this quarter (<1M)
- Four weeks out from the End-of-Quarter surrender period, many Liable Entities are still well short of their requirements. ClearView can help identify who in the Clearing House will benefit
- The weekly and monthly STC creation tally are displayed on our website – check in regularly.
Want more information? Subscribe to ClearView
Solar Hot Spots
- Alice Springs was one of the top hot spots in Q2 2013; 25% of its total capacity being installed in that period.
- in NSW, Smithfield (outer Sydney) had a record quarter
- In SA, Hilton had a record quarter, an average system size of 8.5kW and has only 1% penetration
- in Tas, Forest had a blinder, almost doubling its installed capacity and with an average system size of 11kW
- Things were more stable in Victoria’s hot spots, but Happy Valley added 50% to its installed capacity.
- WA was much quieter, but Malaga still managed an average system size of 26kW and has consistent installation levels
Want more information? Subscribe to Solar Hot Spots
PVsell News
Our PVsell training webinar is available online. Here’s what we’ve added recently:
- Four new commercial load profiles that you can use to appropriately size your system to minimise export and maximise profitability
- An online help system
We’re also in the process of adding more support features.
Want to be more strategic? Subscribe to PVsell.
SunWiz Activities
In the last months, SunWiz has:
- Performed opportunity assessment on a number of potential Solar Power sites for a local council
- Performed a solar pre-feasibility study for a museum
- Assisted an inverter manufacture in assessing opportunities to enter the Australian market
- Delivered custom PVsell training
- Researched every major electricity retailers price structure in 2013 across the nation
- Assisted with 4x grid connections in the 35-80kW range (one of which came through in hours)
- Met with visiting international Solar CEOs
- Been so grateful for my health, even while confronted by death in the family and other emotionally challenging times
With so many solar power systems installed in Australia, it’s little wonder that I see solar panels everywhere. As I was about to take my first skydive last week, the person I had entrusted my life to asked what my line of work was. After disclosing that I work in the solar industry, I commented that the skydive centre should certainly buy a solar power system. Minutes later, hurtling towards the earth, I had to chuckle to myself – for even when faced with my own mortality somehow my mind registered that there was indeed already solar panels on the skydiving roof. And at this rate, I’m guessing that it won’t be long before Australia’s first solar farms are visible from space.
To celebrate that the solar industry has survived its earlier freefall and lives to continually reach new milestones, SunWiz is releasing a free mini-series of Insights drawn from its market leading monthly publication (for which subscribers pay $275/month or more). This will be bonanza of market information, expanding upon today’s topics and also covering pricing, large-scale systems, market share, and SunWiz exclusive content. But to get this free Insights mini-series, you’ll have to subscribe to a dedicated Insights mailing list by subscribing here (even if you receive SunWiz’s regular mailout).
What do market leading industry participants have in common? They subscribe to Insights – and from across the spectrum. Each month our regular update on installed capacity, system size distribution, pricing, imports, market share, large-scale systems, special features and essential news stories reaches the desks of PV manufacturers, wholesalers, retailers, installers, and even the government. Insights helps PV businesses make informed decisions and outsmart their competitors.
Market Synopsis
PV Market
- 75MW of PV was registered in October, and similar figures in November.
- SA overtook Queensland to be November’s biggest installation location.
- Average System Sizes are 4.8kW in SA, but far smaller at 3.4kW in WA
Want more information? Subscribe to Insights
STC Market
- Seven large STC creators still hold 100% of the STCs they’ve ever created, but much of it is sitting outside of the Clearing House
- Most of the trading that is taking place in the market is of much-traded STCs – those that have been traded 7 times or more.
- Origin now creates less than 10,000 STCs per week, where once it exceeded 250,000
- The weekly and monthly STC creation tally are displayed on our website – check in regularly.
Want more information? Subscribe to ClearView
Solar Hot Spots
- Most upturn in the market is focussed on SA, though most installation levels are below earlier peaks.
- Hilton SA had two successive record quarters; Lonsdale also set records (off the back of some commercial installations it seems)
- Rosewater and Emu Flat also set records
Want more information? Subscribe to Solar Hot Spots
PVsell News
We had a major release recently that included:
- PDF Creation & Emailing from within PVsell
- New graphs & improvement on existing graphs
- New graphs on the load profile visualiser
- New pricing entry method
- Easy Downloading Datasheets as CSV
- Projects Modified Date & Time
- Performance Adjustment by Location
Want to be sell more commercial? Subscribe to PVsell.
SunWiz Activities
In the last months, SunWiz has:
- Developed a custom version of PVsell for an innovative solar offer
- Been re-elected as the Chair of the Domestic PV Directorate of the Clean Energy Council
- Assisted with multiple grid connect applications
- Performed ROI calculations on PVsell for customers
- Fallen out of a plane (and survived)
To learn more about what we can do for your solar business
- Great guerilla marketing photos of solar power… http://t.co/KGyiRy8Wfm
- ZEN Energy and Business SA partner to provide commercial solar over 5-7 year rental plan http://t.co/ty4hdOnJhj
- SunWiz was featured in The Courier Mail: Solar panels turn suburban homes into QLD’s fourth biggest power station http://t.co/q4eEOr3Xm2
- RT @The_RiotACT: Three new power plants for you: Photon Energy are planning to build three mid-sized solar power plan… http://t.co/Fd2OJR…
- RT @ClimateSpec: EDIS: Campbell Newman’s electricity tax by stealth http://t.co/yH5mJHoZgI
- APVI study explained: from base case of $1735/year electricity spend, installing an AC will raise your spend to… http://t.co/6AXlEEMYIo
- APVI: PV systems producing 20% of capacity during local distribution network peak demand http://t.co/Tb0I4DIKKI
- SunWiz leads ClimateSpectator – who’s leading commercial markets. Great graphs (even if I do say so myself…)… http://t.co/47jZhKMzS2
- AEMO: 13% of additional generation to 2020 will be solar PV… http://t.co/qK4Rdumere
- Time to get facts right on solar, and reap the benefits – Centre for Policy Development and APVI http://t.co/l3NCvMfAmF
- RT @renew_economy: CEFC saved in the Senate – a rare win for Australian renewables http://t.co/nZfdcBCJ8l #solar #wind
- RT @SimonChapman6: God takes a selfie http://t.co/664s5ZIRUJ


Leave a comment