Solar Market Synopsis: October
86 MW registered in September, the town of Warwick (QLD) a solar hot spot; Discovering a forgotten paradise, great solar pictures
Solar Market Synopsis: October
Australian PV system registrations fell considerably in September, following a general downturn in the market. A downturn was expected after the reduction in solar multiplier drove installations into Q2, but registrations in Q3 were buoyed by the closing feed-in tariffs in Queensland and Victoria, and by the lag between intallation and registration. Overall, 84 MW was registered nationally in September, a 15% fall from August, and 27% lower than the registration peak in June. September was a quieter month in all states other than Victoria, who managed to register the same volume as the previous month. 40% of recent system capacity went into Queensland, with Victoria at 25%. However, registration in both states is expected to decline considerably over coming months.
In Q3 last year, NSW registration plummeted as the backlog of approved systems were finally installed ahead of the multiplier reduction. This effectively sucked the life out of the state, which languised for 12 months. So, perhaps the least-worst news is that NSW has finally recovered from the valley of death that followed its installation boom: Registration figures in Q3 2012 were higher than those for the same period one year ago, though still lower than those figures of Q3 2011. A one-to-two year setback must also be considered as possible in Queensland, where 9 months of pre-registered interest was created at the closure of its feed-in tariff. Anecdotally, NSW companies used to selling in the absence of a feed-in tarff are making new sales more easily in Queensland than local companies, but the industry remains dependent upon the SRES to sustain itself as it weans itself off transitionary support provided by the solar multiplier.
As a result of the wind-back in feed-in tariffs, people are moving back towards smaller systems in NSW and WA, which could be considered a less efficient outcome for the environment. This trend is countered by those seeking to make use of the last remaining feed-in tariffs to install a larger system. However, once such installations run out, we may see all states return to smaller systems. This has two impacts worth noting – 1. it increases the competitiveness of the PV industry due to the low barriers to entry, and 2. it removes the state-policy counterbalance to federal policy settings over the past six years that have advantaged lower-quality product.
PV Market
- Last month saw 84MW of PV registered across Australia, a slowdown from the peak of June/July.
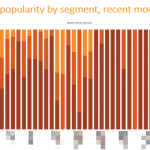
- >20% of Queenslanders recently chose a 5kW system, largely due to the ending feed-in tariff. By contrast those in states without feed-in tariffs sell 5kW systems only 7% of the time.
- The PV industry continues to be highly competitive – the top 20 PV retailers and STC-creating wholesalers only account for 40% of the market
Want more information? Subscribe to Insights.
STC Market
- STC creation has been fairly steady at about 700k/week, but STC trading has noticably fallen in volume
- Demand (purchases) for newly created STCs has fallen considerably in recent weeks, influencing the STC price.
- With just over one week before the Q3 surrender period closes, liable entities already hold sufficient STCs, and the banks hold enough to meet liable entities Q4 requirements.
- However, 6 liable entities remain short of their expected liability.
- The weekly and monthly STC creation tally are displayed on our website – check in regularly.
Want more information? Subscribe to ClearView.
Solar Hot Spots
Of the postcodes with more than 500 installations, the following areas have the largest average system size:
- Postcode 2680 (Griffith NSW) with an average system size of 4.75kW
- Postcode 4564 (Marcoola QLD) with an average system size of 3.52kW
- Postcode 4370 (Warwick QLD (woohoo!!!!)) with an average system size of 3.35kW
- Postcode 4213 (Mudgeeraba QLD) with an average system size of 3.34kW
- Postcode 2620 (Queanbeyan NSW) with an average system size of 3.32kW
Want to know which postcodes have the most PV in recent months? The largest system sizes in recent months? Where is solar hot? Subscribe to Solar Hot Spots.
SunWiz Activities
In the last month, SunWiz has:
- Presented to a standing-room-only audience at All Energy on the topic of how PVsell can help you close more commercial PV sales, more quickly and more accurately. Thanks for your feedback, people are loving what PVsell is doing for their business.
- Designed an interactive dashboard for a PV distributor that helps them find new clients and better service their existing ones.
- Some very exciting things I can’t tell anyone about.
- Extended a custom calculator of PV financial outcome
- Performed numerous evaluations of PV financial outcome, using PVsell to identify the best system size and panel orientation.
- Discovered remnant old-growth forest in a hidden valley in Northern NSW
Great Solar Pictures
This is a photo showin a combination of atmospheric effects caused by sunlight interacting with high-level ice. Its caused by the refraction and reflection of sunlight through geometrically-arranged ice crystals (like ‘icebows’).
For those reading this far, next month I’ll be viewing the most amazing sun-phenomenon: a total solar eclipse (my fourth), in Cairns.