Tutorial on evaluating commercial PV systems
The first questions customers ask when considering installing a PV system are:
• “How much does it cost” and
• “How much will I make”
Giving a detailed, convincing answer to that second question, will greatly help you sell commercial scale PV systems. But calculating the viability of a larger PV system requires complex inputs and analysis of those inputs. Here we show you how to calculate the financial return from a commercial PV system. We also show how SunWiz PV Sell can simply and easily improve the accuracy of calculations, and create a compelling sales message to your customers.
In simple terms, what you need to do is work out how much revenue the system will create in each year, compared to its costs. However, working out the revenue creation can be complicated by factors such as:
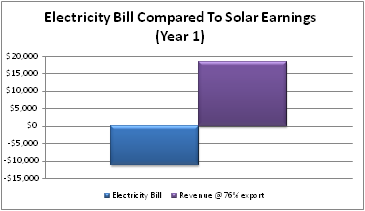
• How much of the solar generation is exported
• For the portion that is consumed on site, what is the average electricity price during solar production
You can guess these by putting your thumb in the air. Or there are some simple ways of estimating these, such as by considering rough daytime power use and by performing a weighted average of weekday and weekend tariffs. For example, if the customer is on an off-peak rate at the weekends then the value of offset electricity consumption is lower for those two days per week. In our experience this commercial customers can have dramatically different load profiles, so in order to answer these questions, you really need to have a detailed understanding of the relationship of the solar production profile to the customer’s load profile, and the tariffs that apply in each moment.
How to Analyse a PV System
The main steps in the analysis are:
- Calculate the predicted PV output for each hour of the year, for the proposed systems, using system and location data.
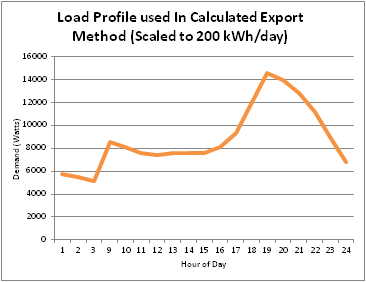
- Determine the customer’s kWh consumed on-site for a year, either using typical daily load profiles or by using data for each hour of the year.
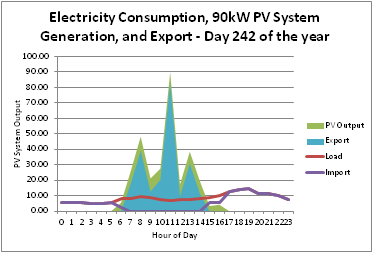
- For each hour of the year, calculate (from the total generation and the total consumption) the reduction in electricity imports and the exported electricity.
- Using electricity tariff details for different times of day (e.g. peak, off-peak and shoulder periods), and 1, 2 and 3 above, calculate the revenue and cost reduction for each period of each day of the year.
- For export power, calculate or estimate the proportion of the generation which is exported for each hour of the year, and use the export tariff (which may vary over the life of the installation) to calculate the revenue.
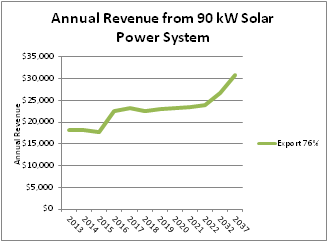
This will arrive at the annual revenue in year one, which allows you to calculate simple payback as the upfront cost divided by the first year revenue.
If this all sounds too complex, remember that PV Sell does all of this for you with ease.
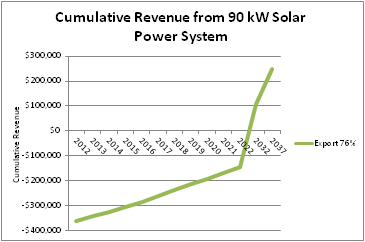
And in year 2, 3, 4, 5, …..25
But what about electricity price rises, panel degradation, and the changes to the STC/LGC value What if your commercial customer has a separate charge for peak demand And what about tax
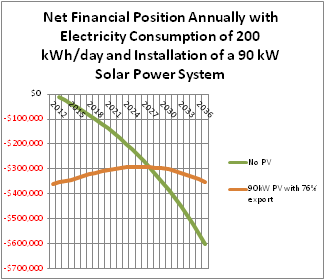
These are all required if you want to calculate true payback, NPV, IRR (effective interest rate): the metrics that are essentially needed to convince an astute purchaser. Once you’ve got these, you’ll need to perform some wizardry in a spreadsheet to calculate the revenue in each year. You’ll then need to consider the time value of money (discount factor) in order to arrive at your customer’s key reason for buying: return on investment.
We suggest modelling a system performance degradation of 0.5% per annum. Electricity price rises are expected to be around 6 to 10% per annum for the next few years, reducing to 3 to 5% thereafter.
Consider whether the installation will reliably reduce the peak demand in each tariff period: this can also reduce the electricity costs for commercial customers. As a rule of thumb, a suitably sized PV system can reduce daytime peak demand by 10 to 30%.
There will be ongoing costs such as maintenance to consider which will be specific to the installation.
The tax analysis needs to incorporate the different net system price paid by businesses due to the tax treatment of revenue from STCs/LGCs. If GST is being claimed upfront, the savings net of GST are based on GST exclusive electricity cost savings. If you are including corporation tax, the system should be depreciated over 20 years unless some exemption applies.
These are all required if you want to calculate true payback, NPV, IRR (effective interest rate): the metrics that are essentially needed to convince an astute purchaser. Once you’ve got these, you’ll need to perform some wizardry in a spreadsheet to calculate the revenue in each year, which will then give you these metrics.
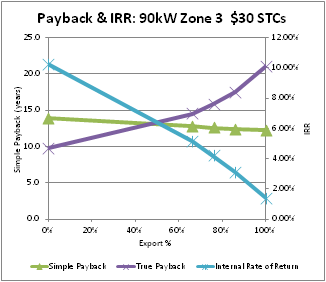
In most cases, the optimum return on investment will be from a system which is sized to be the maximum that will not usually export power, so this analysis needs to be repeated on a range of system sizes.
PV Sell makes it easy
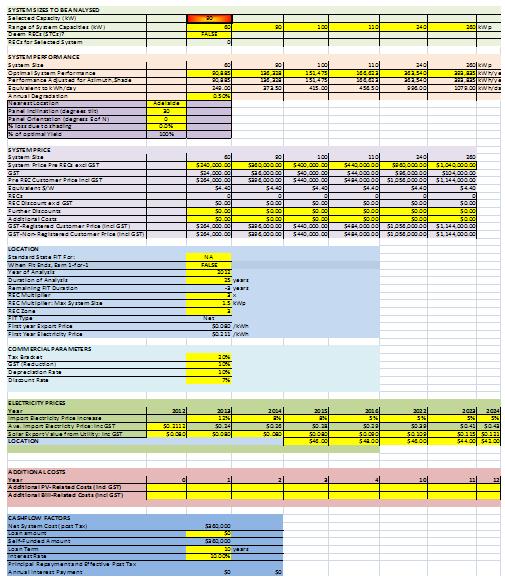
Fortunately, PV Sell does all this for you, for example it:
- Calculates the hourly system output from the location and system type and size
- Estimates hourly demand profile from quarterly bills
- Automatically generates the resulting hourly import, export, revenue and cost reduction
PV Sell also provides a whole host of included functions that assist you in selling solar power:
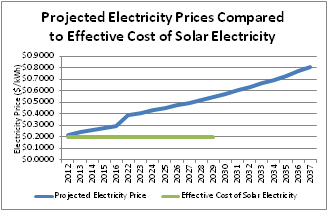
- Projected increase in electricity import and export prices.
- Effects of panel degradation over time
- Different values of LGCs/STCs for systems that are over/under the 100 kW threshold
- Financial benefit of reduction in customer’s peak electricity demand
- Ongoing costs
- Loan details
- Simple and true payback calculations, Net Present Value and Internal Rate of Return.
- Depreciation and tax analysis, including the GST treatment of LGCs/STCs.
Results
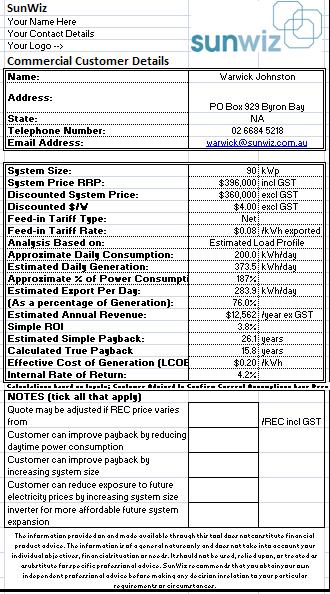
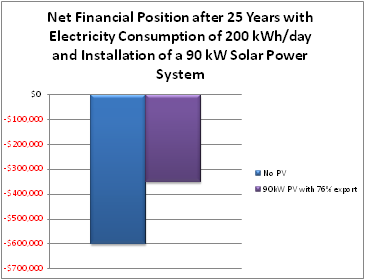
The results are presented in a variety of ways to help get the message across, but they are based on either the simple payback period or the true payback incorporating the cost of capital. See the example Outputs page below for an example. The results are presented in a clear graphical form, but the underlying data and the calculations made are all also available in the spreadsheet. This will allow your customer to incorporate the results of the analysis in their own financial modelling.
In short, your customers will see reliable estimates of how much they can make from a PV system. This reliability and clarity of presentation will increase their confidence in investing in a PV system.