
Five Key Takeaways SunWiz Uncovered about Panel & Inverter manufacturer Market Share
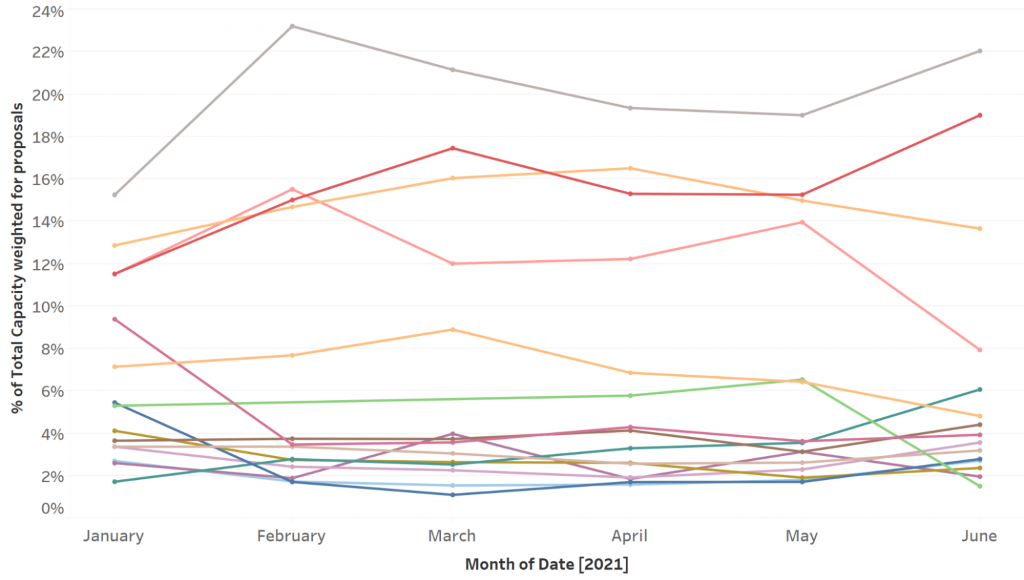
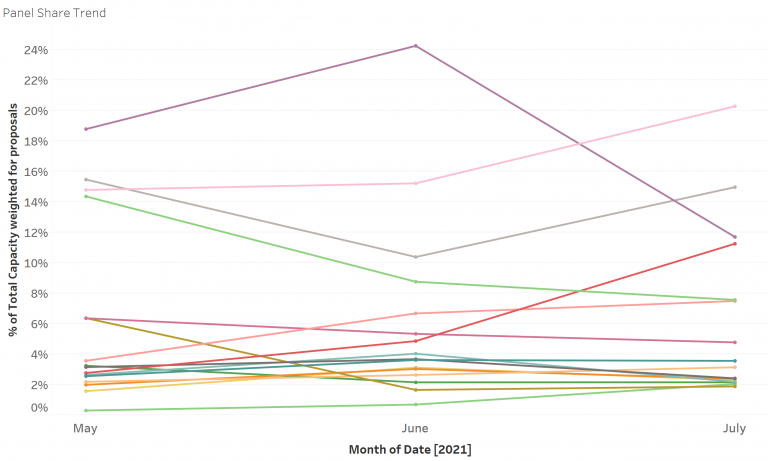
I. There is considerable fluctuation in market share from month to month. However, the market leaders have remained (almost) unassailable for some time now.
II. Market Share varies considerably amongst states. This is associated with the strength of the manufacturers chosen distribution channels, combined with the tendency of some states towards cheaper equipment. For example, this shows the market share in each state of one leading Chinese inverter, which has its greatest market share in Queensland.
III. Most manufacturers follow the 80-20 rule: 80% of their volume is installed by 20% of their retailers. However, some more widely-spread market leaders that have been ‘adopted by all’ have a less-concentrated distribution of market share. This makes them less susceptible to shock from being dropped by one company.
IV. Some brands are stronger in particular market segments than others. For example SMA’s strength in the commercial space isn’t mirrored in the residential segment, likely due to increased competition in this segment. LG has a converse story, and it’s understandable that hard-nosed commercial investors are less likely to invest in
V. Like follows like. Premium brands of panels are more likely to be matched with premium brands of inverters, and vice-versa. Take for example this market share of Risen Panels (left column) compared to all other brands (right column). Risen have a lower than average association with Fronius, and higher than average association with Sungrow and GoodWe.
Finally, you can have a reliable and accurate understanding of the market share of inverter brands!
SunWiz has pulled together market share data from a range of sources, including STC aggregators, finance providers, and software sources.

Combined these represent 1.42GW of proposals and 100MW of confirmed installations for 2021YTD. Adjusting for typical proposal-to-sale conversion rates, this combined figure is 440MW, against a market tally 1422 MW, or 31% of the market.
By reaching a 31% market penetration level through combining multiple data sources, the data is now highly representative of the overall market. We are also fortunate to display anonymised data for 1300+ retailers.