
November 2012: 2GW PV Milestone Aligns with Total Solar Eclipse
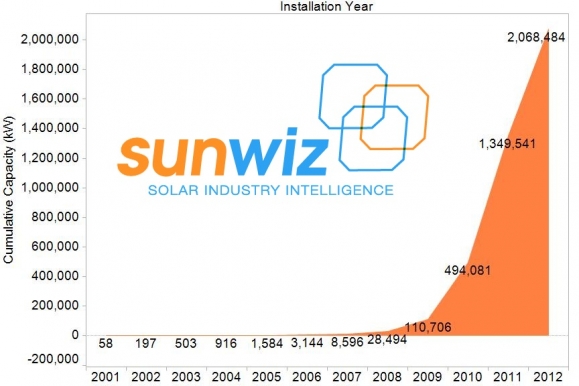
Cumulative Australian PV Installations reached the 2GW Milestone in November 2012.
Shown is the cumulative level of sub-100kW installations. At least 45MW of installations larger than 100kW in size can be added to
2GW Eclipse
Cumulative Australian PV Installations reached the 2GW Milestone in November 2012.
Shown is the cumulative level of sub-100kW installations. At least 45MW of installations larger than 100kW in size can be added to these figuresThe good news is that PVsell can help you close sales under the 2x solar multipier AND help you sell in a post-incentive world by proving the financial returns to your customer.
Australian PV Milestone
(SunWiz performs monthly in-depth analysis of the REC Registry to provide a market intelligence for its PV Insights subscribers. Through careful translation of STC certificate creation volumes, SunWiz is able to provide the market-leading indicator of PV activity with confirmed accuracy. Our market intelligence captures information earlier than the quarterly releases by the Clean Energy Regulator, which have significant lag and exclude systems pending registration.)
November 2012 will be remembered by Australian sunlovers for two noteworthy events: 1) a solar eclipse visible across most of Australia, and 2) the month cumulative Australian PV installations reached 2GW (equivalently 2,000 MW or 2,000,000 kW). This threshold has been reached in previously only-dreamed of rapidity, and has been paradoxically accellerated rather than decelerated by the removal of government incentives. (Politicians take notice, there are tens of thousands of solar voters in your electorate.)
Take for example the case of Queensland. The graph below shows Clean Energy Regulator data released this time last year (red dotted lines), compared with the finalised figures once all installations were accounted for (solid red line), compared with installations registered so far this year. A few things are noteworthy: 1) July-December 2011 were very steady, at comparably low levels; 2) installations in January-June 2012 were significantly greater than at the same point last year, even before all installations are accounted for. So what led to these conditions, and how is this relevant to today?
Well, last year’s reduction in solar multiplier (from 5x to 3x) set off a significant surge in installations, which pulled forward customers that might have otherwise bought in an orderly fashion, plus many that might never have bought solar but wanted to maximise their use of available government incentives. In the first half of this year, Queenslanders began to suspect that soon-to-be-Premier Newman would axe the feed in tariff – this suspicion alone was sufficient to cause people to start people buying, then this year’s multiplier reduction (from 3x to 2x) accelerated the market. Fearing an overheated market, Premier Newman confirmed Queenslander’s suspicions and slashed the feed-in tariff, but not before nearly 100,000 people had applied for it.
Such behaviour plays out internationally as well as locally (witness SA, VIC, WA, and NSW), and can be easily understood in terms of human behaviour. Most people are happy to wait for a better deal, knowing that PV prices are likely to continue to decline. However, when governments remove incentives, people will act very quickly to ensure they get the best possible deal. The nature of the SRES and state feed-in tariffs has been for steep step-declines in incentive levels that have in all likelihood resulted in more PV installed now than might have otherwise been the case.
So today’s 2GW milestone should not be taken as evidence that no further support for PV is needed; to the contrary, PV retailers in many states are struggling to re-write business models to accommodate lower volumes now that the second-last boom has bust. There will be much less work once the backlog of Queensland systems are installed, and SunWiz/Solar Business Services’ Forecast suggest 2013 volumes may only be half their 2012 level (predicted to exceed 900MW this year), with South Australia (the only major state with a reasonable feed-in tariff) to eliminate its tariff in Q3 2013. Today’s milestone provides evidence of the need for a smarter way to gradually and incrementally reduce PV support in line with market conditions, rather than causing another bust by creating an incentive-reduction boom.
This is important in today’s context. The Climate Change Authority is seeking a way to contain SRES costs (SunWiz was honoured to be invited by the CCA to represent the PV industry at its RET Review roundtable). We have argued that the solar booms have been caused by tariff and multiplier reductions which have (finally) almost played out, but the CCA is still fearful of an overheated PV industry acting to impact on retail electricity prices (even while it acknowledges that the impact is offset by a near-equivalent reduction in wholesale electricity prices). However, the main problem with the CCA’s proposal to apply a solar ‘divisor’ to the entire system capacity (not just the first 1.5kW) is that it will need to be fore-communicated by the minister well in advance so that the PV industry can advertise updated pricing to new customers. The minister will need to guess at the level of divisor required to ‘tame’ the industry, even when the market conditions shift faster than the minister can respond. The reduction but is likely to be infrequent and thus aggressive (without any ability to undo the divisor). History has proven that, given this warning of steep reduction in incentives, demand for PV will spike, creating an installation rush followed by a bust.
To avoid this scenario playing out, what is needed is a more gradual adjustment – some ideas being considered by the industry include the STC price (which would behave differently if the SRES had a soft, rolling annual cap), or annually reducing the deeming period from 2016 to coincide with the RET’s end in 2030. We would prefer there to be no change to SRES, particularly because SRES’s contribution to electricity prices has peaked; but if a change must be made, the entire industry would prefer to avoid a perpetuation of the boom-bust that plays out when a steep reduction in incentives occurs. We have written to the CCA arguing that small-commercial PV is unlikely to materially impact electricity prices and should be retained within the SRES, that perpetually adjusting incentives to push paybacks beyond 10 years will leave nobody to maintain systems or meet warranties on existing systems, and that the solar divisor is a blunt instrument that will be counterproductive.
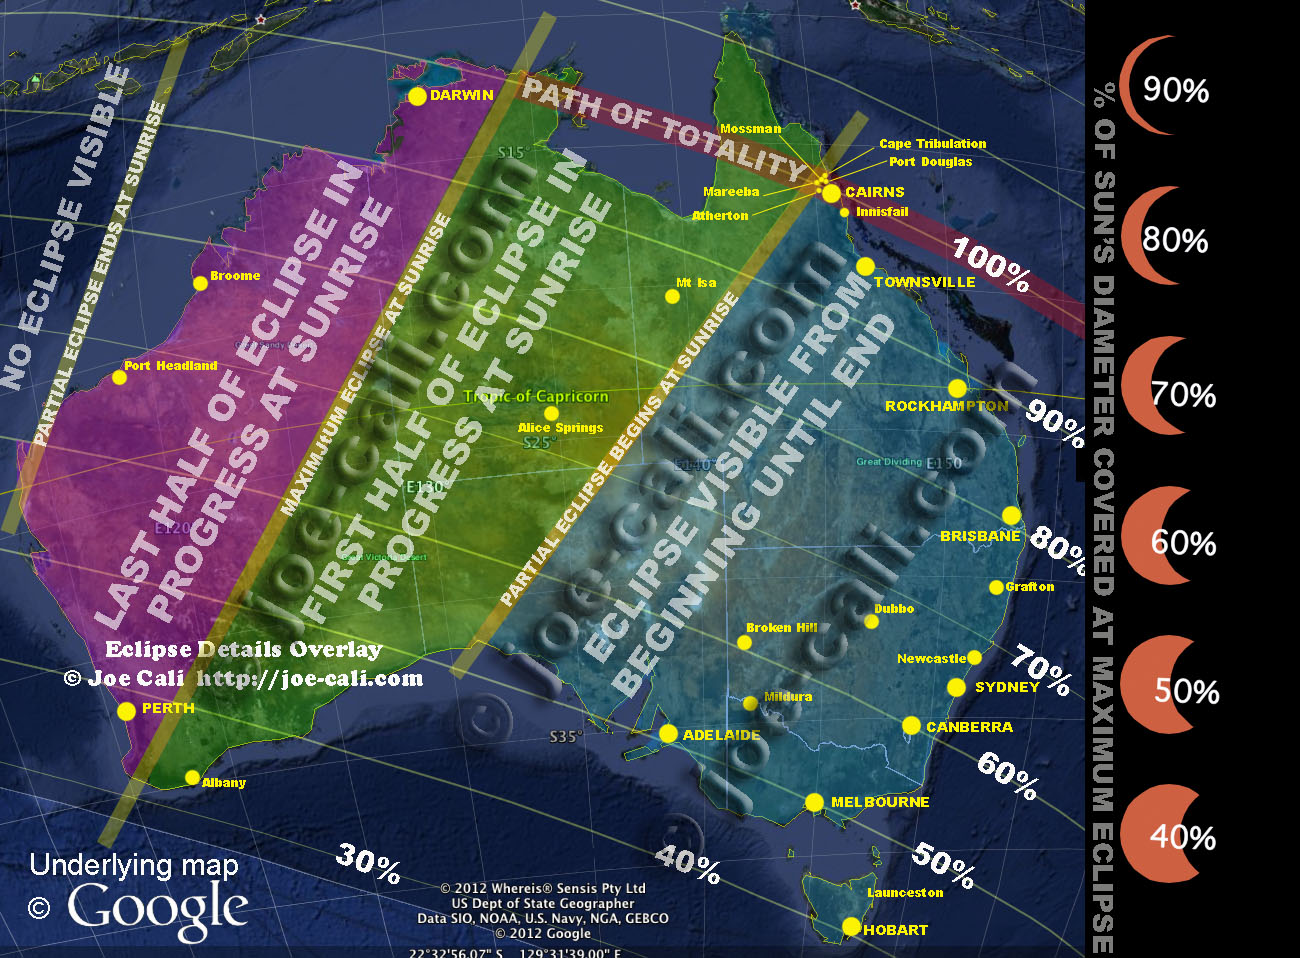
Whatever happens, there must remain an incentive to use accredited product and installers, and to register systems so we can bring you good news like today’s. For with 2GW on the grid, PV now has a material impact upon the electricity market (in which 25-50GW of generation may be active at any time). To successfully operate the market, the Australian Electricity Market Operator (and its participants) need detailed understanding at 5-minute intervals of the volume and performance of PV. Beyond a forecasting excercise, intimate knowledge of PV output behaviour is required, which is why SunWiz invests a lot of time in understanding PV performance, and in tracking how much PV is connected to the grid, and the relationship between deployment and government incentives. We’ll even be watching the impact this month’s solar eclipse has on solar panels across the nation (and the eclipse’s effect on the solar panel we’ll be taking to the path of totality). How eclipsed will you be? Find out here, or see the image below.
Learn more about PVsell at www.pvsell.com.au.
A glimpse of the PVsell dashboard:

Subscribers to SunWiz Market Insights discovered this month:
- How much PV had been registered in October nationally and in each state
- The average size system in each state, plus the most popular system sizes in each state
- How many new applications are flowing through in Queensland
- The prices of systems in each capital city, and how’d they’d changed over the past few months, through SunWiz analysis of Solar Choice Market Insights
- The volume of PV panels imported in recent months, and from where they came
- Large-scale market intelligence, including the volume of systems over 30kW (and who’s installing them), and what prices have won recent tenders
- Characteristics of the USA utility-scale market
- Solar Hot Spots, including how each state is faring compared to last year, and where the stable and growing hot spots are in each state.
If you also want to enjoy some sun-loving fun, read this blog post by Nigel Morris.
SunWiz passionate advocates of the PV industry, representing its interests and contributing to the industry through dialog and studies for the Clean Energy Council, Australian Solar Council, Australian PV Association, Solar Energy Industries Association, 100% Renew (regular donor), and the Australian Energy Market Operator. Warwick Johnston received the AuSES Award for Industry Contribution and Leadership
SunWiz Activities
To learn more about what we can do for your solar business, visit www.sunwiz.com.au
Latest Tweets
- Its happening worldwide-not just Oz “@DanJCass: Polluters pollute politics, to destroy #renewable energy: @KenOatman http://t.co/aMBGJwvg”9:25AM
- Instead of smart meters, how about a $7000 network levy on air conditioners?!!!!http://t.co/lmWFopYG7:44AM
- Australian PV November: An eclipse, a surprise, and a new horizon. 90MW registered last month.http://t.co/AuOCBwgf @renew_economy12:54PM
- PV Market Synopsis: November – http://t.co/V29lK0NF8:00AM
- PVsell’s new ‘multiplier move-on’ feature helps you win sales before the solar multiplier halves –http://t.co/q4ieRieV12:19PM
- AUSTRALIANS overwhelmingly want more renewable energy over the next five yearshttp://t.co/Ry68XdFo7:45AM
Latest Graphs on Facebook
 Great graphs of our decade-low NEM emissions. Go Renewables![see more]11/19/12 6:32PM
- Great Graph from RAA: Solar more popular in low-income areas than amongst the wealthyhttp://www.climatespectator.com.au/commentary/gillard-wrong-solar-and-efficiency[see more]9/18/12 1:29PM
- Yingli likely to displace Suntech as #1 manufacturer in 2012[see more]9/4/12 12:54PM
 Neat graph on the growth of sectors of the US PV market:http://www.renewableenergyworld.com/assets/images/story/2012/8/17/1-large-five-key-takeaways-from-the-u-s-solar-market-trends-report.jpg fromhttp://www.renewableenergyworld.com/rea/news/article/2012/08/five-key-takeaways-from-the-u-s-solar-market-trends-report[see more]8/27/12 10:33AM
- Awesome graphs showing the impact Australian PV has on NEM peak demand and pricing peaks. Melbourne Institute:Thanks![see more]8/23/12 9:28AM


